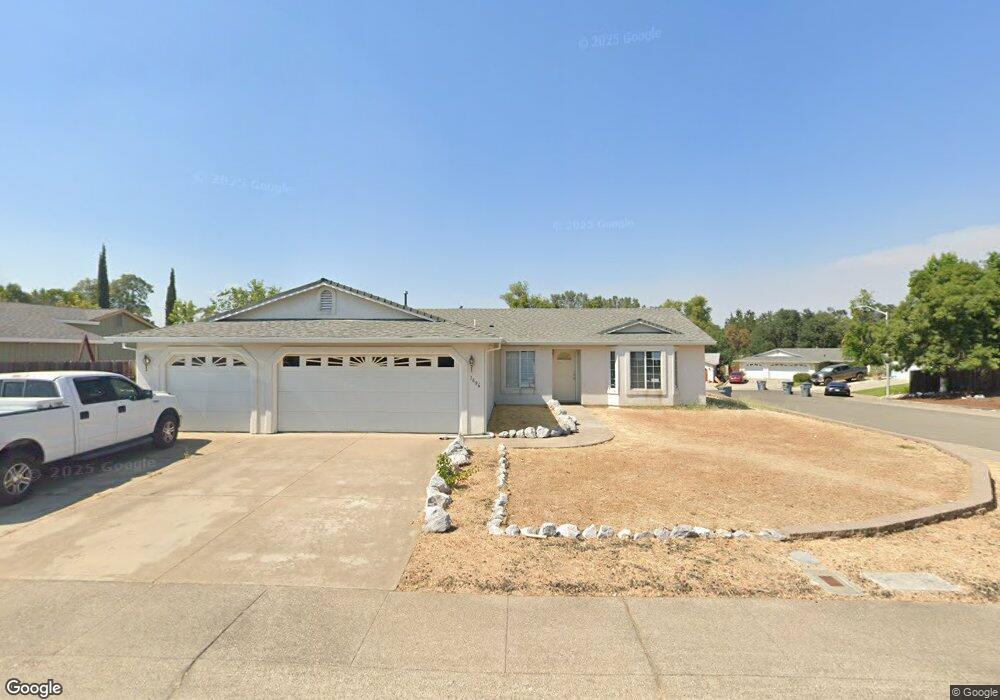
1696 Stetson Way Redding, CA 96003
Simpson University Region NeighborhoodEstimated Value: $336,204 - $392,000
3
Beds
2
Baths
1,418
Sq Ft
$254/Sq Ft
Est. Value
About This Home
This home is located at 1696 Stetson Way, Redding, CA 96003 and is currently estimated at $360,301, approximately $254 per square foot. 1696 Stetson Way is a home located in Shasta County with nearby schools including Columbia Elementary School, Mountain View Middle School, and Foothill High School.
Ownership History
Date
Name
Owned For
Owner Type
Purchase Details
Closed on
Mar 23, 2024
Sold by
Park Willard C
Bought by
Willard C Park Trust and Park
Current Estimated Value
Purchase Details
Closed on
May 14, 2003
Sold by
Park Willard C
Bought by
Park Willard C
Home Financials for this Owner
Home Financials are based on the most recent Mortgage that was taken out on this home.
Original Mortgage
$62,000
Interest Rate
5.71%
Mortgage Type
Purchase Money Mortgage
Purchase Details
Closed on
Jun 15, 2000
Sold by
Park Willard
Bought by
Park Willard C
Purchase Details
Closed on
Mar 8, 1999
Sold by
Three Seasons Developments Inc
Bought by
Park Willard
Home Financials for this Owner
Home Financials are based on the most recent Mortgage that was taken out on this home.
Original Mortgage
$60,000
Interest Rate
6.7%
Mortgage Type
Purchase Money Mortgage
Create a Home Valuation Report for This Property
The Home Valuation Report is an in-depth analysis detailing your home's value as well as a comparison with similar homes in the area
Home Values in the Area
Average Home Value in this Area
Purchase History
| Date | Buyer | Sale Price | Title Company |
|---|---|---|---|
| Willard C Park Trust | -- | None Listed On Document | |
| Park Willard C | -- | Fidelity National Title Co | |
| Park Willard C | -- | -- | |
| Park Willard | $120,000 | Fidelity National Title Co |
Source: Public Records
Mortgage History
| Date | Status | Borrower | Loan Amount |
|---|---|---|---|
| Previous Owner | Park Willard C | $62,000 | |
| Previous Owner | Park Willard | $60,000 |
Source: Public Records
Tax History
| Year | Tax Paid | Tax Assessment Tax Assessment Total Assessment is a certain percentage of the fair market value that is determined by local assessors to be the total taxable value of land and additions on the property. | Land | Improvement |
|---|---|---|---|---|
| 2025 | $2,106 | $188,098 | $39,180 | $148,918 |
| 2024 | $2,113 | $184,411 | $38,412 | $145,999 |
| 2023 | $2,113 | $180,796 | $37,659 | $143,137 |
| 2022 | $2,037 | $177,252 | $36,921 | $140,331 |
| 2021 | $2,027 | $173,778 | $36,198 | $137,580 |
| 2020 | $2,012 | $171,997 | $35,827 | $136,170 |
| 2019 | $1,967 | $168,625 | $35,125 | $133,500 |
| 2018 | $1,977 | $165,320 | $34,437 | $130,883 |
| 2017 | $1,999 | $162,079 | $33,762 | $128,317 |
| 2016 | $1,875 | $158,901 | $33,100 | $125,801 |
| 2015 | $1,846 | $156,515 | $32,603 | $123,912 |
| 2014 | -- | $153,450 | $31,965 | $121,485 |
Source: Public Records
Map
Nearby Homes
- 61 Tidmore Ln
- 19219 Nike Ct
- 332 Franciscan Trail
- 19424 Posey Ln
- 2192 Princeton Way
- 2199 Princeton Way
- 1102 Hope Ln
- 2110 Cadjew St
- 2134 Cadjew St
- 2182 Cadjew St
- 790 Volcano View Trail
- 550 Armando Ave
- 11632 Ridgewood Rd
- 948 & 950 Hawley
- 19340 Carnegie Ct
- 547 Casa Buena St
- 450 Country Oak Dr
- 662 Ansley Ct
- 5961 Sierra Dr
- 531 Fair Hill Dr
- 1696 Stetson Way Unit 1
- 1686 Stetson Way
- 8 Ortega Ct
- 1720 Stetson Way
- 1691 Stetson Way
- 1717 Stetson Way
- 1681 Stetson Way
- 40 Ortega Ct Unit 1
- 63 Ortega Ct
- 1750 Stetson Way
- 33 Ortega Ct
- 1737 Stetson Way
- 10 Juarez Ln
- 10 Ortega Ct
- 1757 Stetson Way
- 1722 Dakota Way
- 1784 Stetson Way
- 1734 Dakota Way
- 1708 Dakota Way
- 1746 Dakota Way
Your Personal Tour Guide
Ask me questions while you tour the home.