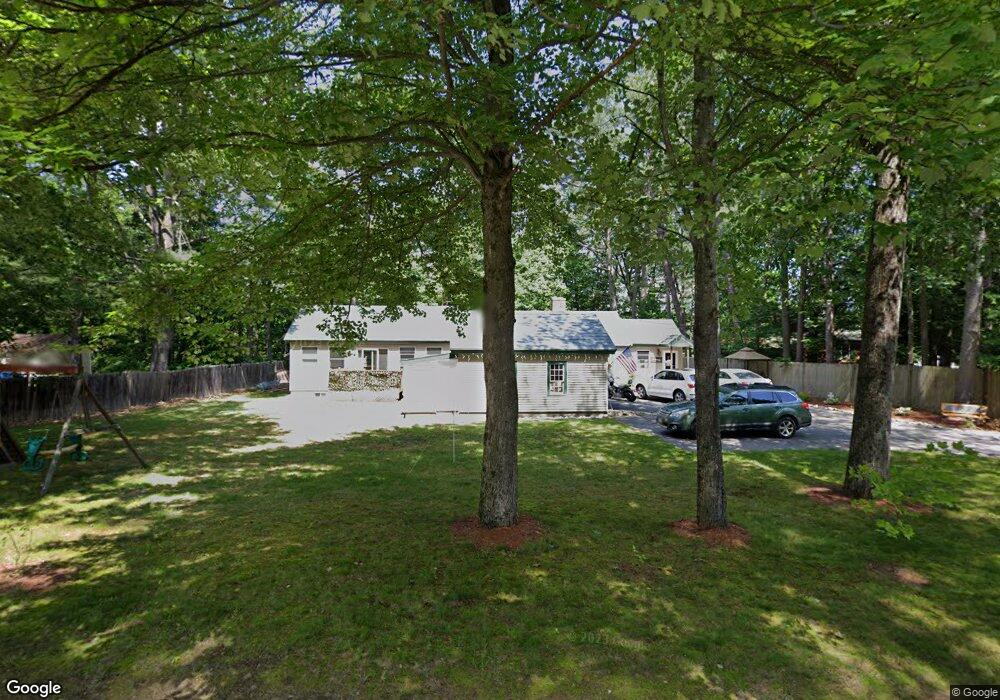
17 Bond St Franklin, NH 03235
Estimated Value: $379,000 - $425,970
3
Beds
2
Baths
1,888
Sq Ft
$215/Sq Ft
Est. Value
About This Home
This home is located at 17 Bond St, Franklin, NH 03235 and is currently estimated at $404,993, approximately $214 per square foot. 17 Bond St is a home located in Merrimack County with nearby schools including Paul A. Smith School, Franklin Middle School, and Franklin High School.
Ownership History
Date
Name
Owned For
Owner Type
Purchase Details
Closed on
Jun 18, 1998
Sold by
Beaulieu Lionel B
Bought by
Hennessy Lawrence K
Current Estimated Value
Home Financials for this Owner
Home Financials are based on the most recent Mortgage that was taken out on this home.
Original Mortgage
$57,500
Interest Rate
7.09%
Create a Home Valuation Report for This Property
The Home Valuation Report is an in-depth analysis detailing your home's value as well as a comparison with similar homes in the area
Home Values in the Area
Average Home Value in this Area
Purchase History
| Date | Buyer | Sale Price | Title Company |
|---|---|---|---|
| Hennessy Lawrence K | $57,500 | -- |
Source: Public Records
Mortgage History
| Date | Status | Borrower | Loan Amount |
|---|---|---|---|
| Open | Hennessy Lawrence K | $127,916 | |
| Closed | Hennessy Lawrence K | $30,000 | |
| Closed | Hennessy Lawrence K | $57,500 |
Source: Public Records
Tax History Compared to Growth
Tax History
| Year | Tax Paid | Tax Assessment Tax Assessment Total Assessment is a certain percentage of the fair market value that is determined by local assessors to be the total taxable value of land and additions on the property. | Land | Improvement |
|---|---|---|---|---|
| 2024 | $5,627 | $328,100 | $76,000 | $252,100 |
| 2023 | $5,335 | $328,100 | $76,000 | $252,100 |
| 2022 | $4,980 | $204,200 | $61,800 | $142,400 |
| 2021 | $4,739 | $204,200 | $61,800 | $142,400 |
| 2020 | $4,554 | $199,400 | $61,800 | $137,600 |
| 2019 | $4,694 | $208,900 | $61,800 | $147,100 |
| 2018 | $4,587 | $208,900 | $61,800 | $147,100 |
| 2017 | $3,665 | $143,400 | $23,300 | $120,100 |
| 2016 | $3,618 | $143,400 | $23,300 | $120,100 |
| 2015 | $2,491 | $99,820 | $16,310 | $83,510 |
| 2011 | $3,105 | $144,300 | $23,800 | $120,500 |
Source: Public Records
Map
Nearby Homes
- 319 Victory Dr
- 11 Racine St
- 261 N Main St
- 150 Victory Dr
- 0 Rowell Dr Unit 406 5043422
- 21 Lake Ave
- 21 Mountain View Dr
- 00 Finch and Kidder Ave
- 69 Lake Ave
- Lot 4 Piper St
- 4 Trail St
- 208 Sanborn St
- 187 Summit St
- 46 Sanborn St
- 9 Hunt Ave
- 416 Central St
- 36 Lark St
- 157 Summit St
- 53 Lark St
- 104 New Hampton Rd