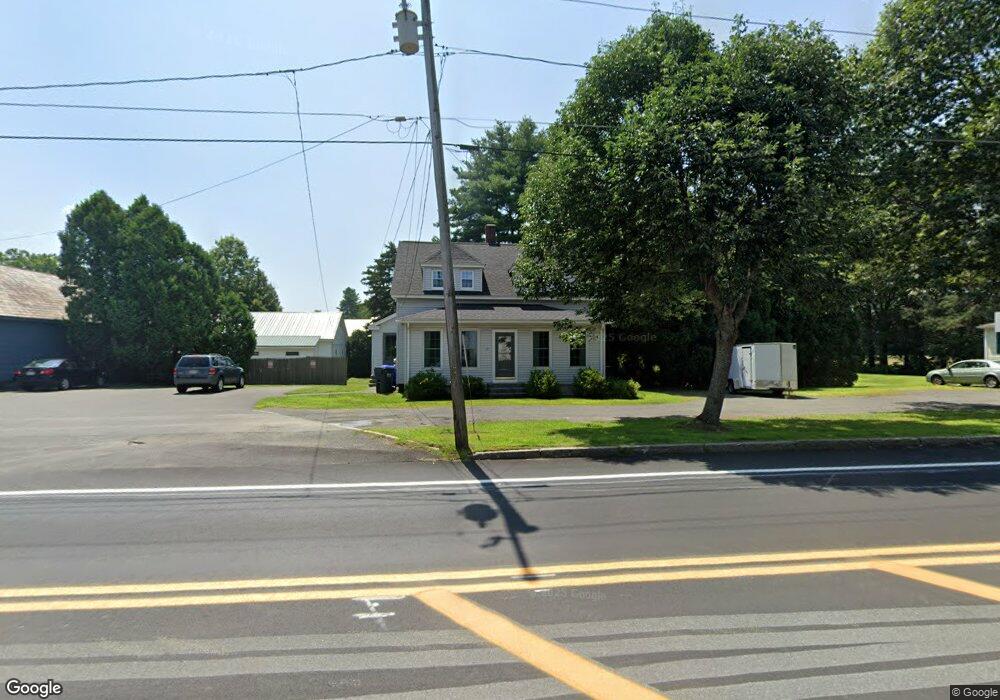
17 Bridge St Sunderland, MA 01375
Estimated Value: $406,626
4
Beds
2
Baths
1,790
Sq Ft
$227/Sq Ft
Est. Value
About This Home
This home is located at 17 Bridge St, Sunderland, MA 01375 and is currently estimated at $406,626, approximately $227 per square foot. 17 Bridge St is a home located in Franklin County with nearby schools including Sunderland Elementary School and Frontier Regional School.
Ownership History
Date
Name
Owned For
Owner Type
Purchase Details
Closed on
Mar 30, 2018
Sold by
Tozloski Barre E and Tozloski Elizabeth
Bought by
Sackrey John H and Sackrey Traci S
Current Estimated Value
Home Financials for this Owner
Home Financials are based on the most recent Mortgage that was taken out on this home.
Original Mortgage
$192,000
Outstanding Balance
$160,561
Interest Rate
3.5%
Mortgage Type
New Conventional
Estimated Equity
$244,180
Purchase Details
Closed on
Apr 25, 1994
Sold by
Taylor Bryan D and Taylor Lizabeth L
Bought by
Conger Susan F
Home Financials for this Owner
Home Financials are based on the most recent Mortgage that was taken out on this home.
Original Mortgage
$69,900
Interest Rate
7.6%
Mortgage Type
Commercial
Create a Home Valuation Report for This Property
The Home Valuation Report is an in-depth analysis detailing your home's value as well as a comparison with similar homes in the area
Home Values in the Area
Average Home Value in this Area
Purchase History
| Date | Buyer | Sale Price | Title Company |
|---|---|---|---|
| Sackrey John H | $240,000 | -- | |
| Conger Susan F | $108,900 | -- | |
| Conger Susan F | $108,900 | -- |
Source: Public Records
Mortgage History
| Date | Status | Borrower | Loan Amount |
|---|---|---|---|
| Open | Sackrey John H | $192,000 | |
| Closed | Conger Susan F | $192,000 | |
| Previous Owner | Conger Susan F | $69,900 | |
| Previous Owner | Conger Susan F | $13,000 |
Source: Public Records
Tax History
| Year | Tax Paid | Tax Assessment Tax Assessment Total Assessment is a certain percentage of the fair market value that is determined by local assessors to be the total taxable value of land and additions on the property. | Land | Improvement |
|---|---|---|---|---|
| 2025 | $4,095 | $314,500 | $99,700 | $214,800 |
| 2024 | $4,133 | $314,500 | $99,700 | $214,800 |
| 2023 | $3,788 | $295,900 | $91,100 | $204,800 |
| 2022 | $3,815 | $259,500 | $78,300 | $181,200 |
| 2021 | $3,042 | $230,200 | $71,800 | $158,400 |
| 2020 | $1,140 | $230,000 | $71,800 | $158,200 |
| 2019 | $3,434 | $224,000 | $69,800 | $154,200 |
| 2018 | $3,296 | $219,700 | $65,500 | $154,200 |
| 2017 | $3,150 | $219,700 | $66,900 | $152,800 |
| 2016 | $3,218 | $219,500 | $65,500 | $154,000 |
| 2015 | $3,141 | $219,500 | $65,500 | $154,000 |
| 2014 | $3,069 | $219,500 | $65,500 | $154,000 |
Source: Public Records
Map
Nearby Homes
- 15 Crestview Dr
- 33 Eastern Ave
- 0 Greenfield Rd Unit 73472322
- 0 Greenfield Rd Unit 73467449
- 24 Elm St
- 13 Capt Lathrop Dr
- 18 Stage Rd
- 0 Pocumtuck Dr Unit 73379330
- 355 Greenfield Rd
- 59 N Hillside Rd
- 208 Greenfield Rd
- 15 S Plain Rd
- 10 Depot Rd
- 38 S Plain Rd
- 7 Christian Ln
- 0 North St Unit 73407299
- 6 Shattuck Rd
- 30 Lee Rd
- 100 Depot Rd
- 3 Frost Ln
Your Personal Tour Guide
Ask me questions while you tour the home.