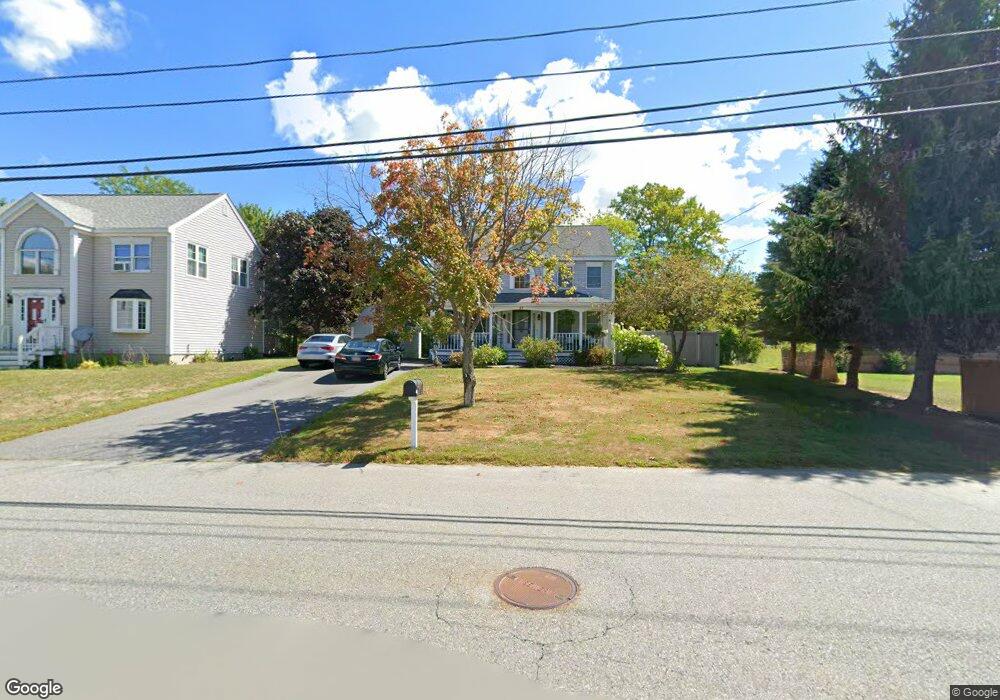
17 Brookside Dr Gardner, MA 01440
Estimated Value: $452,642 - $479,000
3
Beds
2
Baths
1,488
Sq Ft
$312/Sq Ft
Est. Value
About This Home
This home is located at 17 Brookside Dr, Gardner, MA 01440 and is currently estimated at $464,911, approximately $312 per square foot. 17 Brookside Dr is a home located in Worcester County with nearby schools including Gardner High School and Holy Family Academy.
Ownership History
Date
Name
Owned For
Owner Type
Purchase Details
Closed on
Mar 19, 2015
Sold by
Core Real Properties L
Bought by
Saint Pauls T
Current Estimated Value
Purchase Details
Closed on
Sep 27, 1999
Sold by
Walton Lawrence A and Walton Carolyn A
Bought by
Freitas Gregory A and Freitas Wendy A
Purchase Details
Closed on
Oct 19, 1998
Sold by
Smock Mark C and Smock Tina M
Bought by
Walton Lawrence A and Walton Carolyn A
Create a Home Valuation Report for This Property
The Home Valuation Report is an in-depth analysis detailing your home's value as well as a comparison with similar homes in the area
Home Values in the Area
Average Home Value in this Area
Purchase History
| Date | Buyer | Sale Price | Title Company |
|---|---|---|---|
| Saint Pauls T | -- | -- | |
| Freitas Gregory A | $128,900 | -- | |
| Walton Lawrence A | $118,000 | -- |
Source: Public Records
Mortgage History
| Date | Status | Borrower | Loan Amount |
|---|---|---|---|
| Previous Owner | Walton Lawrence A | $10,000 | |
| Previous Owner | Walton Lawrence A | $116,600 | |
| Previous Owner | Walton Lawrence A | $126,000 |
Source: Public Records
Tax History
| Year | Tax Paid | Tax Assessment Tax Assessment Total Assessment is a certain percentage of the fair market value that is determined by local assessors to be the total taxable value of land and additions on the property. | Land | Improvement |
|---|---|---|---|---|
| 2025 | $52 | $359,500 | $75,200 | $284,300 |
| 2024 | $5,261 | $351,000 | $68,400 | $282,600 |
| 2023 | $5,033 | $312,000 | $67,400 | $244,600 |
| 2022 | $4,776 | $256,900 | $51,000 | $205,900 |
| 2021 | $4,633 | $231,200 | $44,300 | $186,900 |
| 2020 | $4,414 | $223,600 | $44,300 | $179,300 |
| 2019 | $4,274 | $212,200 | $44,300 | $167,900 |
| 2018 | $3,993 | $197,000 | $44,300 | $152,700 |
| 2017 | $4,033 | $196,900 | $44,300 | $152,600 |
| 2016 | $3,873 | $189,200 | $44,300 | $144,900 |
| 2015 | $3,664 | $183,400 | $44,300 | $139,100 |
| 2014 | $3,451 | $182,900 | $51,500 | $131,400 |
Source: Public Records
Map
Nearby Homes
Your Personal Tour Guide
Ask me questions while you tour the home.