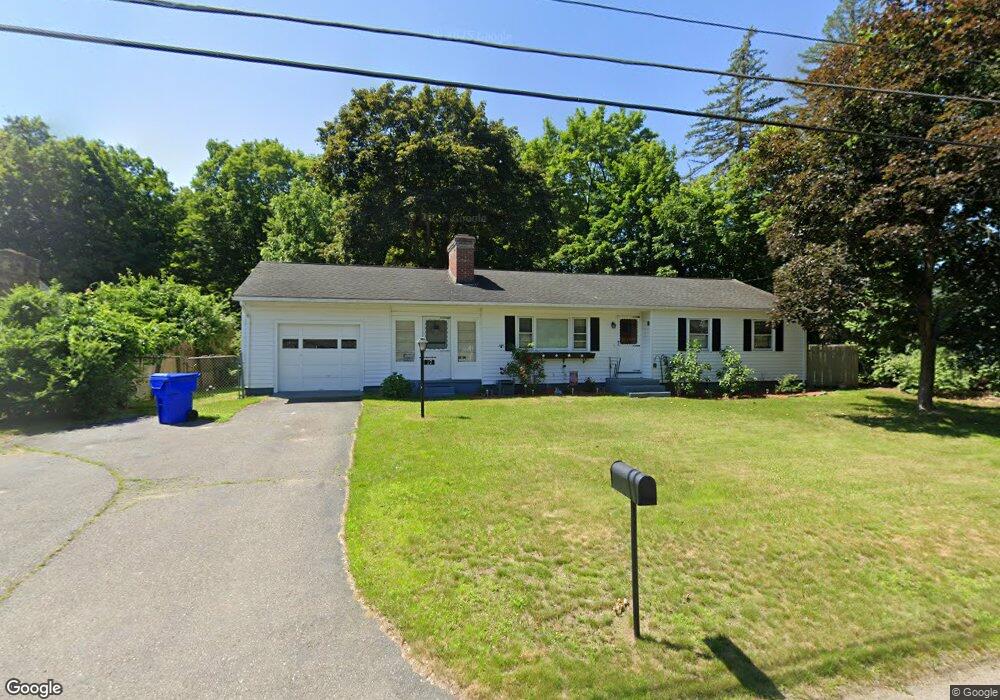
17 Chauncey Dr Springfield, MA 01129
Boston Road NeighborhoodEstimated Value: $284,000 - $317,603
3
Beds
2
Baths
1,052
Sq Ft
$291/Sq Ft
Est. Value
About This Home
This home is located at 17 Chauncey Dr, Springfield, MA 01129 and is currently estimated at $305,901, approximately $290 per square foot. 17 Chauncey Dr is a home located in Hampden County with nearby schools including Warner, M Marcus Kiley Middle, and Springfield Central High School.
Ownership History
Date
Name
Owned For
Owner Type
Purchase Details
Closed on
Sep 19, 2003
Sold by
Gayle David E and Gayle Dennis
Bought by
Gayle David E
Current Estimated Value
Purchase Details
Closed on
Jun 29, 1989
Sold by
Dyba Adele A
Bought by
Gayle Rudolph
Home Financials for this Owner
Home Financials are based on the most recent Mortgage that was taken out on this home.
Original Mortgage
$88,300
Interest Rate
10.56%
Mortgage Type
Purchase Money Mortgage
Create a Home Valuation Report for This Property
The Home Valuation Report is an in-depth analysis detailing your home's value as well as a comparison with similar homes in the area
Home Values in the Area
Average Home Value in this Area
Purchase History
| Date | Buyer | Sale Price | Title Company |
|---|---|---|---|
| Gayle David E | -- | -- | |
| Gayle Rudolph | $115,100 | -- |
Source: Public Records
Mortgage History
| Date | Status | Borrower | Loan Amount |
|---|---|---|---|
| Previous Owner | Gayle Rudolph | $88,300 |
Source: Public Records
Tax History
| Year | Tax Paid | Tax Assessment Tax Assessment Total Assessment is a certain percentage of the fair market value that is determined by local assessors to be the total taxable value of land and additions on the property. | Land | Improvement |
|---|---|---|---|---|
| 2025 | $4,461 | $284,500 | $69,500 | $215,000 |
| 2024 | $4,269 | $265,800 | $69,500 | $196,300 |
| 2023 | $3,913 | $229,500 | $66,200 | $163,300 |
| 2022 | $4,137 | $219,800 | $66,200 | $153,600 |
| 2021 | $3,767 | $199,300 | $60,200 | $139,100 |
| 2020 | $3,584 | $183,500 | $60,200 | $123,300 |
| 2019 | $3,338 | $169,600 | $60,200 | $109,400 |
| 2018 | $3,320 | $168,700 | $60,200 | $108,500 |
| 2017 | $3,203 | $162,900 | $55,200 | $107,700 |
| 2016 | $3,093 | $157,300 | $55,200 | $102,100 |
| 2015 | $3,098 | $157,500 | $55,200 | $102,300 |
Source: Public Records
Map
Nearby Homes
Your Personal Tour Guide
Ask me questions while you tour the home.