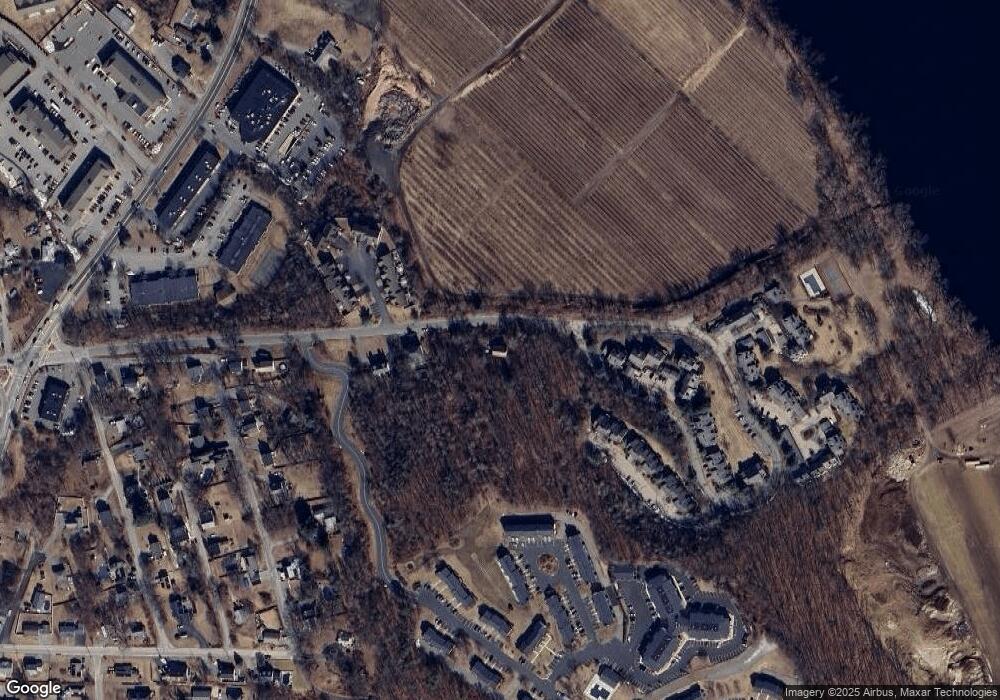
17 Ferry Rd Methuen, MA 01844
The East End NeighborhoodEstimated Value: $692,000 - $758,000
4
Beds
3
Baths
2,064
Sq Ft
$357/Sq Ft
Est. Value
About This Home
This home is located at 17 Ferry Rd, Methuen, MA 01844 and is currently estimated at $736,043, approximately $356 per square foot. 17 Ferry Rd is a home located in Essex County with nearby schools including Methuen High School and Community Day Charter Public School - Gateway.
Ownership History
Date
Name
Owned For
Owner Type
Purchase Details
Closed on
Jun 29, 2000
Sold by
Chan Chung H
Bought by
Allen Gordon E and Allen Dock
Current Estimated Value
Home Financials for this Owner
Home Financials are based on the most recent Mortgage that was taken out on this home.
Original Mortgage
$246,905
Outstanding Balance
$90,602
Interest Rate
8.59%
Mortgage Type
Purchase Money Mortgage
Estimated Equity
$645,441
Purchase Details
Closed on
Feb 6, 1997
Sold by
Scandura Alfio M
Bought by
Best Built Rt
Purchase Details
Closed on
Aug 11, 1995
Sold by
Ray Lin Real Est&Const
Bought by
Terry Shirley
Create a Home Valuation Report for This Property
The Home Valuation Report is an in-depth analysis detailing your home's value as well as a comparison with similar homes in the area
Home Values in the Area
Average Home Value in this Area
Purchase History
| Date | Buyer | Sale Price | Title Company |
|---|---|---|---|
| Allen Gordon E | $259,900 | -- | |
| Best Built Rt | $48,000 | -- | |
| Terry Shirley | $1,000 | -- |
Source: Public Records
Mortgage History
| Date | Status | Borrower | Loan Amount |
|---|---|---|---|
| Open | Terry Shirley | $246,905 |
Source: Public Records
Tax History Compared to Growth
Tax History
| Year | Tax Paid | Tax Assessment Tax Assessment Total Assessment is a certain percentage of the fair market value that is determined by local assessors to be the total taxable value of land and additions on the property. | Land | Improvement |
|---|---|---|---|---|
| 2025 | $6,811 | $643,800 | $300,100 | $343,700 |
| 2024 | $6,744 | $621,000 | $273,200 | $347,800 |
| 2023 | $6,442 | $550,600 | $241,900 | $308,700 |
| 2022 | $6,075 | $465,500 | $200,500 | $265,000 |
| 2021 | $5,727 | $434,200 | $190,100 | $244,100 |
| 2020 | $5,695 | $423,700 | $190,100 | $233,600 |
| 2019 | $5,677 | $400,100 | $179,800 | $220,300 |
| 2018 | $5,551 | $389,000 | $179,800 | $209,200 |
| 2017 | $5,275 | $360,100 | $169,400 | $190,700 |
| 2016 | $5,280 | $356,500 | $169,400 | $187,100 |
| 2015 | $4,945 | $338,700 | $159,000 | $179,700 |
Source: Public Records
Map
Nearby Homes
- 17 Ferry Rd
- 66 Newbury Ave
- 331 Merrimack St
- 29 Pitman St
- 29 Wallace St
- 10 Albermarle St
- 95 Pilgrim Cir Unit 95
- 23 Constitution Way Unit 23
- 23 Constitution Way
- 4 Horne St
- 48 Wingate Ave
- 69 Cross Rd Unit 1A
- 46 Gaston St
- 15 Rivers Edge Place
- 22 Derry Rd
- 301 Farrwood Dr
- 40 Comet Rd
- 34 Varnum Ave
- 15 Burrill Ave
- 213 Farrwood Dr
