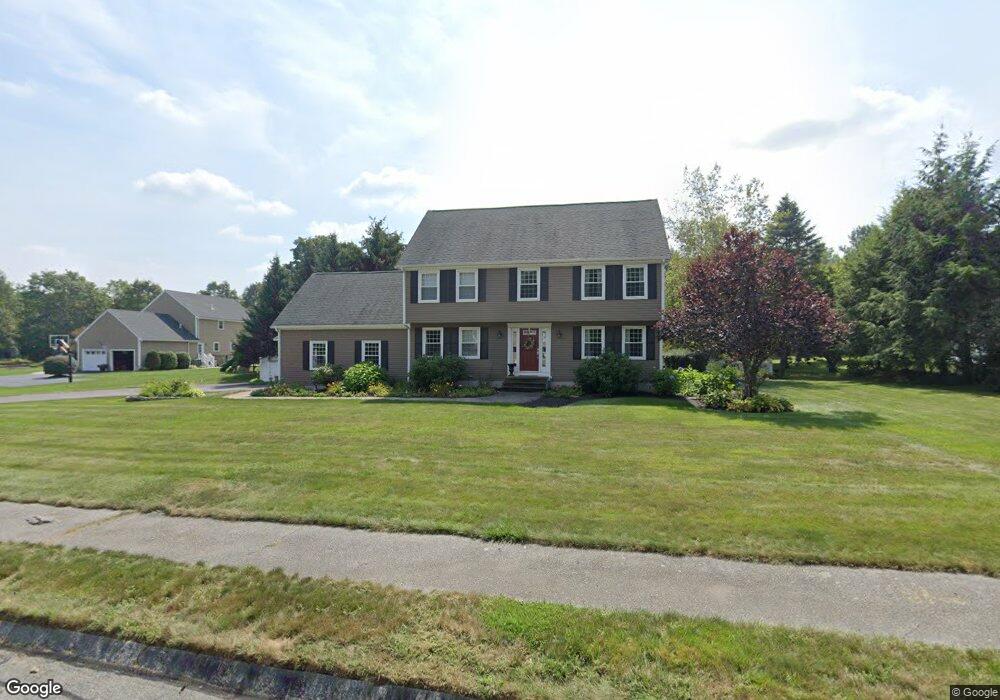
17 Hunters Run Franklin, MA 02038
Wadsworth NeighborhoodEstimated Value: $909,671 - $994,000
4
Beds
3
Baths
2,403
Sq Ft
$401/Sq Ft
Est. Value
About This Home
This home is located at 17 Hunters Run, Franklin, MA 02038 and is currently estimated at $962,668, approximately $400 per square foot. 17 Hunters Run is a home located in Norfolk County with nearby schools including Jefferson Elementary School, Remington Middle School, and Franklin High School.
Ownership History
Date
Name
Owned For
Owner Type
Purchase Details
Closed on
Sep 1, 2021
Sold by
Schmauder Kenneth J and Schmauder April H
Bought by
17 Hunters Run Nt
Current Estimated Value
Purchase Details
Closed on
Jul 24, 1992
Sold by
Marinella Constr Inc
Bought by
Schnauder Kenneth J and Schnauder April H
Create a Home Valuation Report for This Property
The Home Valuation Report is an in-depth analysis detailing your home's value as well as a comparison with similar homes in the area
Home Values in the Area
Average Home Value in this Area
Purchase History
| Date | Buyer | Sale Price | Title Company |
|---|---|---|---|
| 17 Hunters Run Nt | -- | None Available | |
| Schnauder Kenneth J | $220,000 | -- |
Source: Public Records
Mortgage History
| Date | Status | Borrower | Loan Amount |
|---|---|---|---|
| Previous Owner | Schnauder Kenneth J | $285,000 | |
| Previous Owner | Schnauder Kenneth J | $255,000 |
Source: Public Records
Tax History Compared to Growth
Tax History
| Year | Tax Paid | Tax Assessment Tax Assessment Total Assessment is a certain percentage of the fair market value that is determined by local assessors to be the total taxable value of land and additions on the property. | Land | Improvement |
|---|---|---|---|---|
| 2025 | $9,298 | $800,200 | $377,400 | $422,800 |
| 2024 | $9,568 | $811,500 | $377,400 | $434,100 |
| 2023 | $8,785 | $698,300 | $320,600 | $377,700 |
| 2022 | $9,373 | $667,100 | $334,000 | $333,100 |
| 2021 | $8,252 | $563,300 | $280,000 | $283,300 |
| 2020 | $7,972 | $549,400 | $280,000 | $269,400 |
| 2019 | $8,013 | $546,600 | $277,100 | $269,500 |
| 2018 | $7,685 | $524,600 | $282,900 | $241,700 |
| 2017 | $7,776 | $533,300 | $291,600 | $241,700 |
| 2016 | $7,328 | $505,400 | $267,400 | $238,000 |
| 2015 | $6,769 | $456,100 | $218,100 | $238,000 |
| 2014 | $6,829 | $472,600 | $234,600 | $238,000 |
Source: Public Records
Map
Nearby Homes
- 584 Washington St
- 732 King St
- 10 Stanford Rd
- 17 Stanford Rd
- 246 Washington St
- 1 Spring St
- 851 Washington St
- 236 Williams St
- 0 Fall Ln
- 6 Woodchester Rd
- 50 Wamsutta Way
- 417 Union St
- 1 Joy St
- 55 Lawrence Dr Unit 55
- 955 Summer St
- 29 Lawrence Dr
- 374-378 Union St
- 1 Pond Place
- 8 Bubbling Brook Rd
- 7 Howard Place