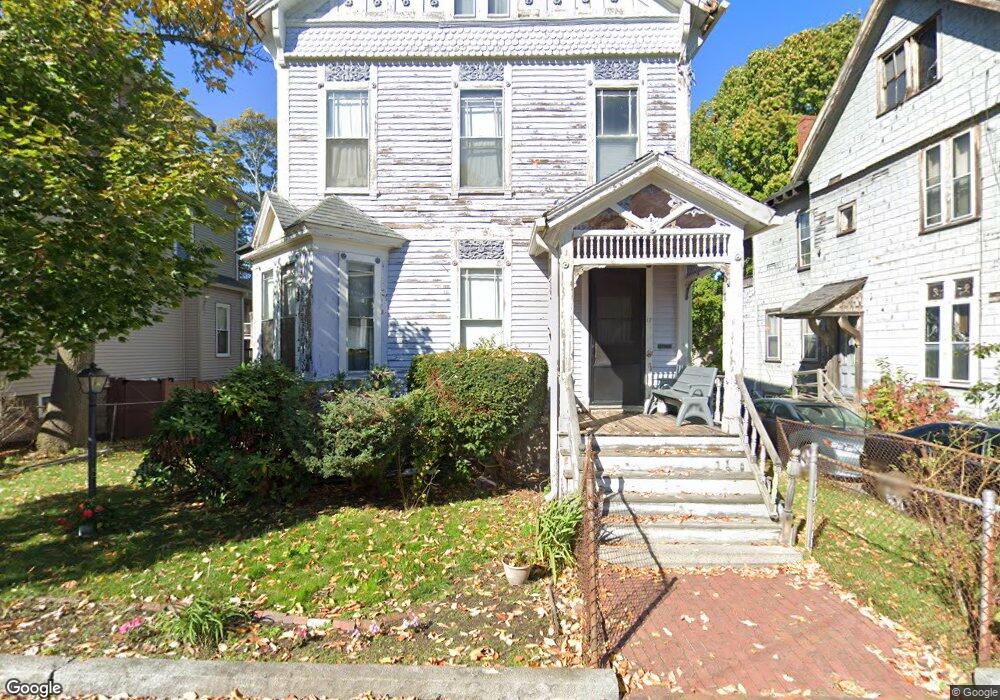
17 Mayfair St Roxbury, MA 02119
Washington Park NeighborhoodEstimated Value: $748,000 - $939,000
5
Beds
2
Baths
2,621
Sq Ft
$331/Sq Ft
Est. Value
About This Home
This home is located at 17 Mayfair St, Roxbury, MA 02119 and is currently estimated at $866,468, approximately $330 per square foot. 17 Mayfair St is a home located in Suffolk County with nearby schools including Bridge Boston Charter School, City on a Hill Charter Public School, and Nativity Preparatory School.
Ownership History
Date
Name
Owned For
Owner Type
Purchase Details
Closed on
Sep 25, 2025
Sold by
Clark Emla M
Bought by
Mayfair Street T and Mayfair Morgan
Current Estimated Value
Purchase Details
Closed on
Apr 1, 1991
Sold by
Cedar Capital Corp and Alliance Funding Co
Bought by
Clark Michelle F and Clark Emla M
Purchase Details
Closed on
Dec 13, 1990
Sold by
Carithers Natalie E
Bought by
Alliance Funding Co
Create a Home Valuation Report for This Property
The Home Valuation Report is an in-depth analysis detailing your home's value as well as a comparison with similar homes in the area
Home Values in the Area
Average Home Value in this Area
Purchase History
| Date | Buyer | Sale Price | Title Company |
|---|---|---|---|
| Mayfair Street T | -- | -- | |
| Clark Michelle F | $102,000 | -- | |
| Alliance Funding Co | $98,000 | -- | |
| Alliance Funding Co | $98,000 | -- |
Source: Public Records
Mortgage History
| Date | Status | Borrower | Loan Amount |
|---|---|---|---|
| Previous Owner | Alliance Funding Co | $120,000 | |
| Previous Owner | Alliance Funding Co | $22,000 | |
| Previous Owner | Alliance Funding Co | $94,000 |
Source: Public Records
Tax History Compared to Growth
Tax History
| Year | Tax Paid | Tax Assessment Tax Assessment Total Assessment is a certain percentage of the fair market value that is determined by local assessors to be the total taxable value of land and additions on the property. | Land | Improvement |
|---|---|---|---|---|
| 2025 | $8,012 | $691,900 | $222,700 | $469,200 |
| 2024 | $7,109 | $652,200 | $215,800 | $436,400 |
| 2023 | $7,005 | $652,200 | $215,800 | $436,400 |
| 2022 | $6,632 | $609,600 | $201,700 | $407,900 |
| 2021 | $6,504 | $609,600 | $201,700 | $407,900 |
| 2020 | $6,053 | $573,200 | $189,800 | $383,400 |
| 2019 | $5,646 | $535,700 | $140,900 | $394,800 |
| 2018 | $5,013 | $478,300 | $140,900 | $337,400 |
| 2017 | $4,732 | $446,800 | $140,900 | $305,900 |
| 2016 | $4,268 | $388,025 | $116,947 | $271,078 |
| 2015 | $4,257 | $351,500 | $94,100 | $257,400 |
| 2014 | $4,170 | $331,500 | $94,100 | $237,400 |
Source: Public Records
Map
Nearby Homes
- 16 Mayfair St
- 8 Brinton St Unit 2
- 90 Munroe St
- 2856 Washington St
- 151 Townsend St
- 9-45 Vale St
- 99 Harrishof St
- 35-37 Notre Dame St
- 26-28-30 Notre Dame St
- 94 Walnut Ave
- 9 W Cedar St Unit 1
- 63 Beech Glen St
- 9 Abbotsford St Unit 1
- 4 Ruthven St
- 4 Fort Ave Unit 2
- 51 Beech Glen St Unit 3
- 28 Wabon St
- 41 W Walnut Park
- 10 Rockland St Unit 4
- 39 W Walnut Park
- 19 Mayfair St
- 15 Mayfair St
- 12 Kensington St
- 12 Kensington St Unit 2
- 12 Kensington St Unit 1
- 14 Kensington St
- 14 Kensington St Unit 2
- 10 Kensington St
- 10 Kensington St
- 10 Kensington St Unit 2
- 10 Kensington St Unit 3
- 16 Kensington St Unit 3
- 16 Kensington St Unit 2
- 16 Kensington St Unit 1
- 16 Kensington St
- 16 Mayfair St Unit 1
- 16 Mayfair St Unit 2
- 21 Mayfair St
- 24 Elmore St
- 14 Mayfair St