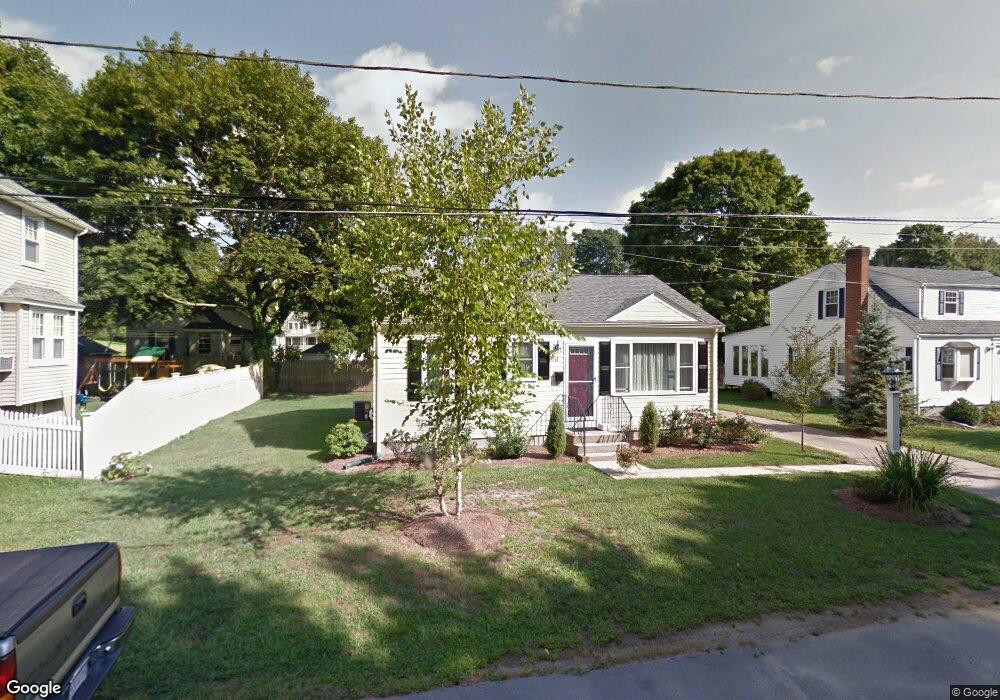
17 Orchard St Unit . Franklin, MA 02038
Downtown Franklin NeighborhoodEstimated Value: $439,000 - $617,000
3
Beds
1
Bath
816
Sq Ft
$618/Sq Ft
Est. Value
About This Home
This home is located at 17 Orchard St Unit ., Franklin, MA 02038 and is currently estimated at $504,458, approximately $618 per square foot. 17 Orchard St Unit . is a home located in Norfolk County with nearby schools including Oak Street Elementary School, Horace Mann Middle School, and Franklin High School.
Ownership History
Date
Name
Owned For
Owner Type
Purchase Details
Closed on
Jul 6, 2011
Sold by
Brodsky Wayne and Brodsky Ann M
Bought by
Leblanc Denise
Current Estimated Value
Home Financials for this Owner
Home Financials are based on the most recent Mortgage that was taken out on this home.
Original Mortgage
$266,000
Outstanding Balance
$20,060
Interest Rate
4.6%
Mortgage Type
Purchase Money Mortgage
Estimated Equity
$484,398
Purchase Details
Closed on
Nov 23, 2010
Sold by
Acqui Selene Rmof Reo
Bought by
Brodsky Wayne R and Brodsky Anne M
Purchase Details
Closed on
Apr 8, 2010
Sold by
Conroy Neil P
Bought by
Selene Rmof Reo Acqu L
Purchase Details
Closed on
Jun 30, 2006
Sold by
Allard David L and Conroy Donna M
Bought by
Conroy Neil P
Home Financials for this Owner
Home Financials are based on the most recent Mortgage that was taken out on this home.
Original Mortgage
$225,000
Interest Rate
6.58%
Mortgage Type
Purchase Money Mortgage
Create a Home Valuation Report for This Property
The Home Valuation Report is an in-depth analysis detailing your home's value as well as a comparison with similar homes in the area
Home Values in the Area
Average Home Value in this Area
Purchase History
| Date | Buyer | Sale Price | Title Company |
|---|---|---|---|
| Leblanc Denise | $299,900 | -- | |
| Brodsky Wayne R | $150,000 | -- | |
| Selene Rmof Reo Acqu L | $167,860 | -- | |
| Conroy Neil P | $285,000 | -- |
Source: Public Records
Mortgage History
| Date | Status | Borrower | Loan Amount |
|---|---|---|---|
| Open | Leblanc Denise | $266,000 | |
| Previous Owner | Conroy Neil P | $225,000 |
Source: Public Records
Tax History
| Year | Tax Paid | Tax Assessment Tax Assessment Total Assessment is a certain percentage of the fair market value that is determined by local assessors to be the total taxable value of land and additions on the property. | Land | Improvement |
|---|---|---|---|---|
| 2025 | $4,798 | $412,900 | $219,000 | $193,900 |
| 2024 | $4,487 | $380,600 | $219,000 | $161,600 |
| 2023 | $4,316 | $343,100 | $202,600 | $140,500 |
| 2022 | $4,312 | $306,900 | $182,500 | $124,400 |
| 2021 | $4,042 | $275,900 | $171,300 | $104,600 |
| 2020 | $4,312 | $297,200 | $197,600 | $99,600 |
| 2019 | $3,923 | $267,600 | $168,000 | $99,600 |
| 2018 | $3,872 | $264,300 | $174,600 | $89,700 |
| 2017 | $3,709 | $254,400 | $164,700 | $89,700 |
| 2016 | $3,745 | $258,300 | $177,800 | $80,500 |
| 2015 | $3,470 | $233,800 | $153,300 | $80,500 |
| 2014 | $3,026 | $209,400 | $128,900 | $80,500 |
Source: Public Records
Map
Nearby Homes
- 14 Pleasant St Unit B
- 17 Longhill Rd
- 70 Oak St
- 88 Crescent St
- 120 Union St Unit 1
- 204 Lincoln St
- 30 Longobardi Dr Unit 30
- 90 E Central St Unit 103
- 90 E Central St Unit 106
- 90 E Central St Unit 304
- 90 E Central St Unit 202
- 90 E Central St Unit 105
- 90 E Central St Unit 301
- 99 Summer St
- 62 Uncas Ave
- 64 Uncas Ave
- 76 Uncas Ave
- 66 Uncas Ave
- 68 Uncas Ave
- 1801 Franklin Crossing Rd Unit 1801
Your Personal Tour Guide
Ask me questions while you tour the home.