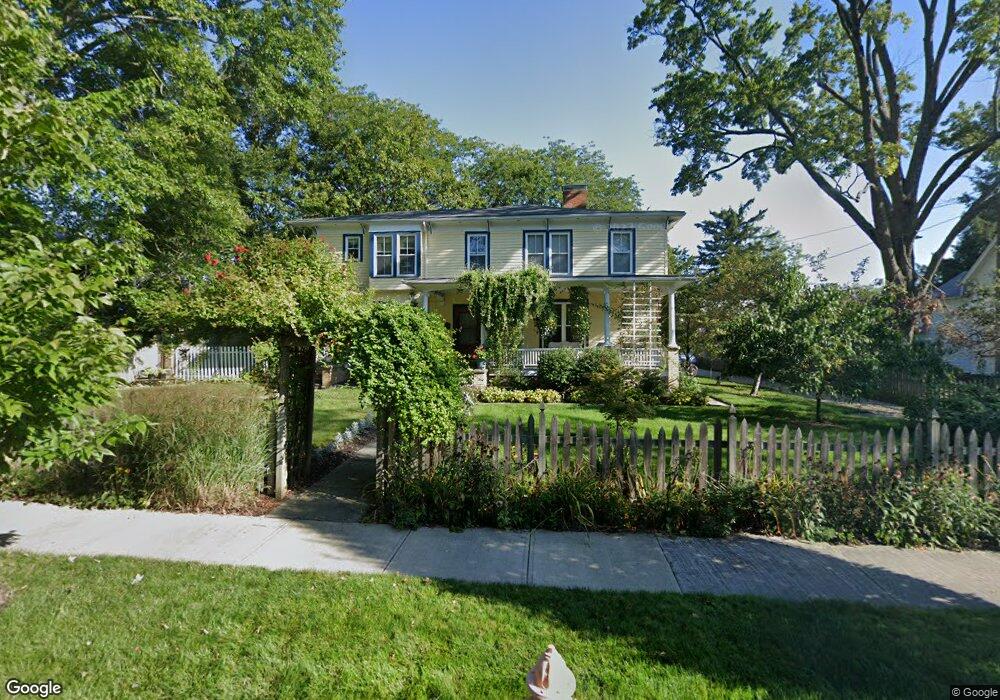
170 Morgan St Oberlin, OH 44074
Estimated Value: $359,000 - $413,000
3
Beds
3
Baths
3,062
Sq Ft
$126/Sq Ft
Est. Value
About This Home
This home is located at 170 Morgan St, Oberlin, OH 44074 and is currently estimated at $384,700, approximately $125 per square foot. 170 Morgan St is a home located in Lorain County with nearby schools including Oberlin Elementary School, Prospect Elementary School, and Langston Middle School.
Ownership History
Date
Name
Owned For
Owner Type
Purchase Details
Closed on
Jun 25, 2002
Sold by
Edward Fenzl
Bought by
Luczkowski David A and Luczkowski Deborah J
Current Estimated Value
Home Financials for this Owner
Home Financials are based on the most recent Mortgage that was taken out on this home.
Original Mortgage
$155,500
Interest Rate
6.82%
Purchase Details
Closed on
Apr 3, 1998
Sold by
Getty James A and Getty Mildred
Bought by
Fenzl Edward and Fenzl Aukina
Home Financials for this Owner
Home Financials are based on the most recent Mortgage that was taken out on this home.
Original Mortgage
$142,500
Interest Rate
7.09%
Purchase Details
Closed on
Feb 13, 1998
Sold by
Getty James A and Getty Mildred
Bought by
Getty James A and Getty Mildred
Home Financials for this Owner
Home Financials are based on the most recent Mortgage that was taken out on this home.
Original Mortgage
$142,500
Interest Rate
7.09%
Create a Home Valuation Report for This Property
The Home Valuation Report is an in-depth analysis detailing your home's value as well as a comparison with similar homes in the area
Home Values in the Area
Average Home Value in this Area
Purchase History
| Date | Buyer | Sale Price | Title Company |
|---|---|---|---|
| Luczkowski David A | $183,000 | Real Living Title Agency Ltd | |
| Fenzl Edward | $150,200 | Midland Title | |
| Getty James A | -- | Midland Title |
Source: Public Records
Mortgage History
| Date | Status | Borrower | Loan Amount |
|---|---|---|---|
| Previous Owner | Luczkowski David A | $155,500 | |
| Previous Owner | Fenzl Edward | $142,500 |
Source: Public Records
Tax History Compared to Growth
Tax History
| Year | Tax Paid | Tax Assessment Tax Assessment Total Assessment is a certain percentage of the fair market value that is determined by local assessors to be the total taxable value of land and additions on the property. | Land | Improvement |
|---|---|---|---|---|
| 2024 | $4,466 | $90,839 | $23,702 | $67,137 |
| 2023 | $3,201 | $58,219 | $13,923 | $44,296 |
| 2022 | $3,116 | $58,219 | $13,923 | $44,296 |
| 2021 | $3,109 | $58,219 | $13,923 | $44,296 |
Source: Public Records
Map
Nearby Homes
- 149 Morgan St
- 147 Morgan St
- 123 S Professor St
- 121 S Professor St
- 89 S Professor St
- 81 S Professor St
- 190 Elm St
- 215 W College St
- 18 Edison St
- 252 W College St
- 296 S Pleasant St
- 83 S Pleasant St
- 118 Locust St
- 461 W Lorain St
- 182 E Hamilton St
- 216 N Main St
- 230 N Main St
- 14409 State Route 58
- 396 Reserve Ave
- 110 Shipherd Cir