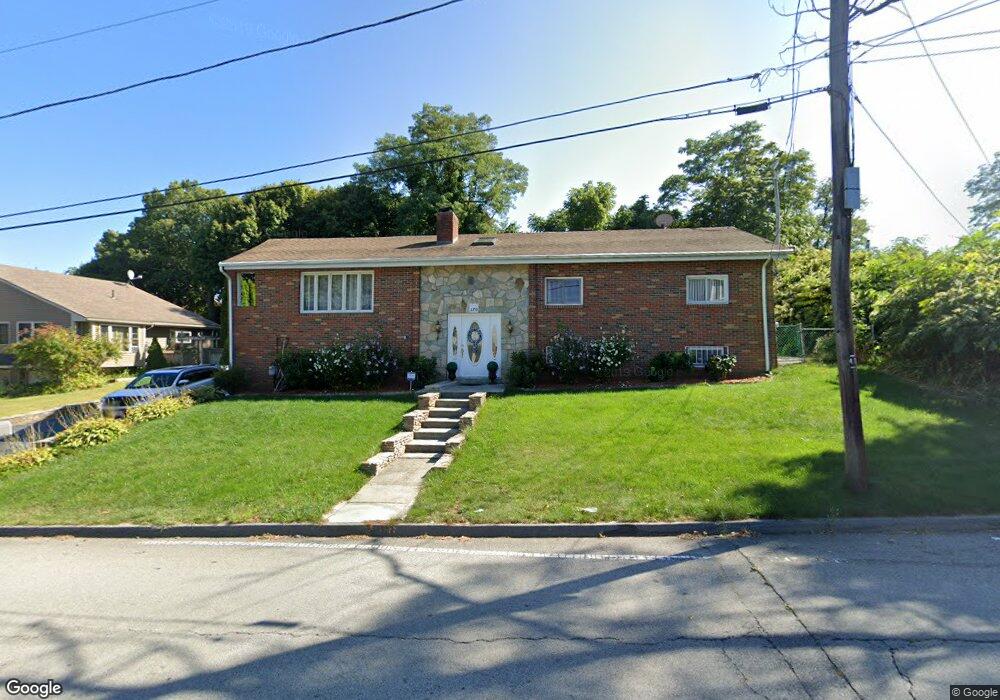
170 Orient St Worcester, MA 01604
Franklin Plantation NeighborhoodEstimated Value: $509,000 - $547,000
4
Beds
3
Baths
1,912
Sq Ft
$278/Sq Ft
Est. Value
About This Home
This home is located at 170 Orient St, Worcester, MA 01604 and is currently estimated at $530,729, approximately $277 per square foot. 170 Orient St is a home located in Worcester County with nearby schools including Jacob Hiatt Magnet School, Chandler Magnet, and Grafton Street.
Ownership History
Date
Name
Owned For
Owner Type
Purchase Details
Closed on
Nov 15, 2007
Sold by
Piombino Angelo and Piombino Joanne
Bought by
Cabrera Jannet and Cabrera Mario D
Current Estimated Value
Home Financials for this Owner
Home Financials are based on the most recent Mortgage that was taken out on this home.
Original Mortgage
$215,000
Outstanding Balance
$136,243
Interest Rate
6.41%
Mortgage Type
Purchase Money Mortgage
Estimated Equity
$394,486
Create a Home Valuation Report for This Property
The Home Valuation Report is an in-depth analysis detailing your home's value as well as a comparison with similar homes in the area
Home Values in the Area
Average Home Value in this Area
Purchase History
| Date | Buyer | Sale Price | Title Company |
|---|---|---|---|
| Cabrera Jannet | $294,500 | -- |
Source: Public Records
Mortgage History
| Date | Status | Borrower | Loan Amount |
|---|---|---|---|
| Open | Cabrera Jannet | $215,000 |
Source: Public Records
Tax History
| Year | Tax Paid | Tax Assessment Tax Assessment Total Assessment is a certain percentage of the fair market value that is determined by local assessors to be the total taxable value of land and additions on the property. | Land | Improvement |
|---|---|---|---|---|
| 2025 | $6,437 | $488,000 | $118,700 | $369,300 |
| 2024 | $6,251 | $454,600 | $118,700 | $335,900 |
| 2023 | $6,119 | $426,700 | $103,200 | $323,500 |
| 2022 | $5,320 | $349,800 | $82,600 | $267,200 |
| 2021 | $5,390 | $331,100 | $66,100 | $265,000 |
| 2020 | $5,134 | $302,000 | $66,100 | $235,900 |
| 2019 | $5,213 | $289,600 | $59,500 | $230,100 |
| 2018 | $5,242 | $277,200 | $59,500 | $217,700 |
| 2017 | $5,009 | $260,600 | $59,500 | $201,100 |
| 2016 | $5,012 | $243,200 | $43,700 | $199,500 |
| 2015 | $4,881 | $243,200 | $43,700 | $199,500 |
| 2014 | $4,752 | $243,200 | $43,700 | $199,500 |
Source: Public Records
Map
Nearby Homes
- 115 Orient St
- 247 Shrewsbury St
- 34 Robin Rd
- 29 Chilmark St
- 1 Verdi Rd
- 24 Ingleside Ave
- 28 Adams St Unit 304
- 28 Granby Rd
- 68 Dartmouth St
- 25 Johnson St
- 256 Belmont St
- 155 Hamilton St Unit 4
- 78 Gage St
- 13 Groton Place
- 103 Hamilton St
- 5 Mcfarland Ct
- 80 Delmont Ave
- 360 Hamilton St
- 107 Eastern Ave
- 109 Merrifield St
Your Personal Tour Guide
Ask me questions while you tour the home.