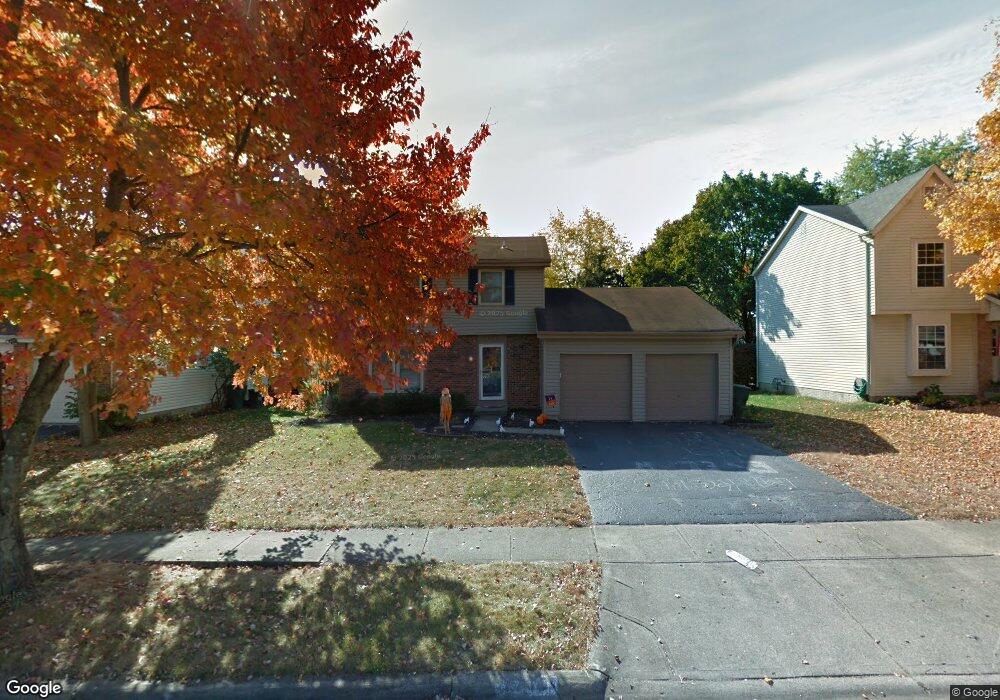
1703 Rushing Way Columbus, OH 43235
Brookside Village NeighborhoodEstimated Value: $350,725 - $404,000
3
Beds
3
Baths
1,540
Sq Ft
$249/Sq Ft
Est. Value
About This Home
This home is located at 1703 Rushing Way, Columbus, OH 43235 and is currently estimated at $383,931, approximately $249 per square foot. 1703 Rushing Way is a home located in Franklin County with nearby schools including Brookside Elementary School, McCord Middle School, and Worthington Kilbourne High School.
Ownership History
Date
Name
Owned For
Owner Type
Purchase Details
Closed on
Mar 13, 2012
Sold by
Marker Patrick J and Marker Malia K
Bought by
Marker Patrick J and Parker Maliak
Current Estimated Value
Home Financials for this Owner
Home Financials are based on the most recent Mortgage that was taken out on this home.
Original Mortgage
$160,857
Interest Rate
3.5%
Mortgage Type
FHA
Purchase Details
Closed on
Jul 7, 2008
Sold by
Norris Cathy J and Norris Robert
Bought by
Marker Patrick J and Marker Mary R
Home Financials for this Owner
Home Financials are based on the most recent Mortgage that was taken out on this home.
Original Mortgage
$164,886
Interest Rate
6.1%
Mortgage Type
Purchase Money Mortgage
Purchase Details
Closed on
Jul 2, 1996
Sold by
Schwanekamp Edwin V
Bought by
Kruki Michael J and Kruki Holly Anne
Home Financials for this Owner
Home Financials are based on the most recent Mortgage that was taken out on this home.
Original Mortgage
$114,008
Interest Rate
8.13%
Mortgage Type
FHA
Purchase Details
Closed on
Nov 12, 1991
Purchase Details
Closed on
Aug 11, 1989
Create a Home Valuation Report for This Property
The Home Valuation Report is an in-depth analysis detailing your home's value as well as a comparison with similar homes in the area
Home Values in the Area
Average Home Value in this Area
Purchase History
| Date | Buyer | Sale Price | Title Company |
|---|---|---|---|
| Marker Patrick J | -- | Bxtalon | |
| Marker Patrick J | -- | None Available | |
| Marker Patrick J | $171,000 | Attorney | |
| Kruki Michael J | $114,900 | -- | |
| -- | $94,500 | -- | |
| -- | -- | -- |
Source: Public Records
Mortgage History
| Date | Status | Borrower | Loan Amount |
|---|---|---|---|
| Previous Owner | Marker Patrick J | $160,857 | |
| Previous Owner | Marker Patrick J | $164,886 | |
| Previous Owner | Kruki Michael J | $114,008 |
Source: Public Records
Tax History Compared to Growth
Tax History
| Year | Tax Paid | Tax Assessment Tax Assessment Total Assessment is a certain percentage of the fair market value that is determined by local assessors to be the total taxable value of land and additions on the property. | Land | Improvement |
|---|---|---|---|---|
| 2024 | $5,465 | $89,010 | $28,880 | $60,130 |
| 2023 | $5,226 | $89,005 | $28,875 | $60,130 |
| 2022 | $5,074 | $68,570 | $18,620 | $49,950 |
| 2021 | $4,681 | $68,570 | $18,620 | $49,950 |
| 2020 | $4,508 | $68,570 | $18,620 | $49,950 |
| 2019 | $4,124 | $56,600 | $15,510 | $41,090 |
| 2018 | $3,886 | $56,600 | $15,510 | $41,090 |
| 2017 | $3,736 | $56,600 | $15,510 | $41,090 |
| 2016 | $3,777 | $53,200 | $13,790 | $39,410 |
| 2015 | $3,778 | $53,200 | $13,790 | $39,410 |
| 2014 | $3,776 | $53,200 | $13,790 | $39,410 |
| 2013 | $1,879 | $53,200 | $13,790 | $39,410 |
Source: Public Records
Map
Nearby Homes
- 2687 Snouffer Rd
- 1620 Park Row Dr Unit A
- 1721 Worthington Run Dr Unit 1721-1731
- 1637 Park Row Dr Unit F
- 6921 Spruce Pine Dr
- 7164 Durness Place
- 1930 Shallowford Ave
- 1380 Tiehack Ct
- 2056 Fincastle Ct
- 1889 Slaton Ct Unit 1889
- 2161 Heatherfield Ave
- 6550 Winston Ct E
- 1828 Gardenstone Dr
- 2001 Sawbury Blvd Unit 2001
- 7373 Palmleaf Ln
- 1041 Rosebank Dr
- 1307 Lakeside Ct
- 2074 Hard Rd
- 2220 Surreygate Dr
- 1118 Ravine Ridge Dr
- 1695 Rushing Way
- 1711 Rushing Way
- 1687 Rushing Way
- 1723 Rushing Way
- 7176 Pebble Way Ct
- 7164 Pebble Way Ct
- 1714 Rushing Way
- 1679 Rushing Way
- 1731 Rushing Way
- 7188 Pebble Way Ct
- 1688 Rushing Way
- 1688 Flat Rock Ct
- 1722 Rushing Way
- 1680 Rushing Way
- 1667 Rushing Way
- 7167 Pebble Way Ct
- 1739 Rushing Way
- 7204 Pebble Way Ct
- 1736 Rushing Way
- 7251 Rising Way