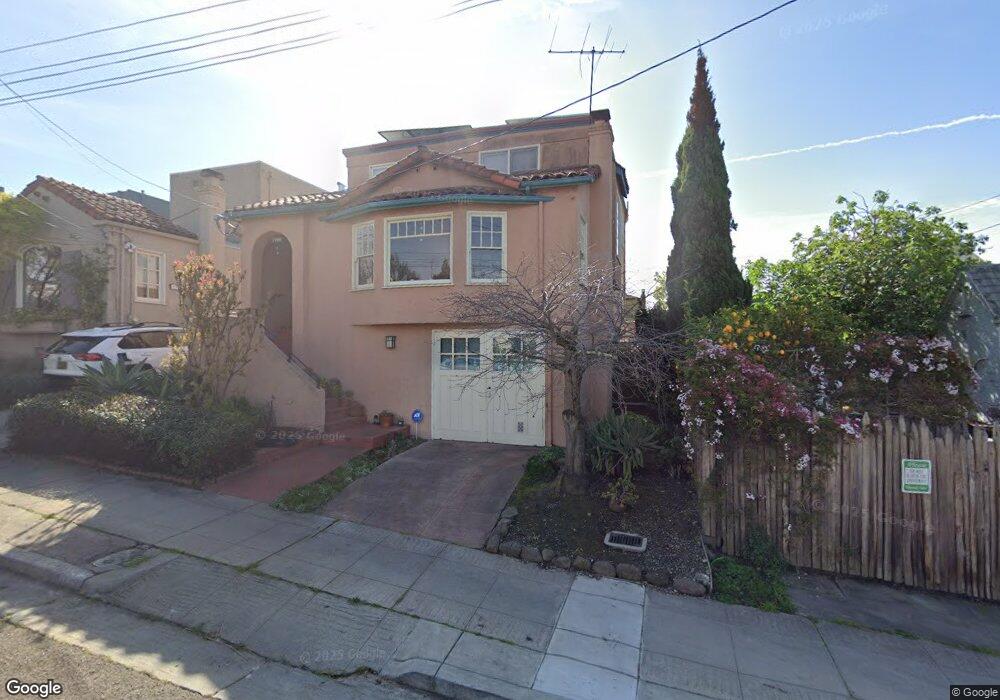
1706 Buena Ave Berkeley, CA 94703
North Berkeley NeighborhoodEstimated Value: $1,408,000 - $1,820,000
3
Beds
2
Baths
2,055
Sq Ft
$817/Sq Ft
Est. Value
About This Home
This home is located at 1706 Buena Ave, Berkeley, CA 94703 and is currently estimated at $1,679,451, approximately $817 per square foot. 1706 Buena Ave is a home located in Alameda County with nearby schools including Ruth Acty Elementary, Berkeley Arts Magnet at Whittier School, and Thousand Oaks Elementary School.
Ownership History
Date
Name
Owned For
Owner Type
Purchase Details
Closed on
Jul 15, 2013
Sold by
Monts P Witt and Shih Lily
Bought by
Monts P Witt and Shih Lily
Current Estimated Value
Purchase Details
Closed on
Mar 13, 2013
Sold by
Monts Paul W and Shih Lily
Bought by
Monts P Witt and Shih Lily
Home Financials for this Owner
Home Financials are based on the most recent Mortgage that was taken out on this home.
Original Mortgage
$190,000
Interest Rate
3.49%
Mortgage Type
New Conventional
Purchase Details
Closed on
Jul 11, 2012
Sold by
Monts P Witt and Shih Lily
Bought by
Monts P Witt and Monts Paul Witt
Create a Home Valuation Report for This Property
The Home Valuation Report is an in-depth analysis detailing your home's value as well as a comparison with similar homes in the area
Home Values in the Area
Average Home Value in this Area
Purchase History
| Date | Buyer | Sale Price | Title Company |
|---|---|---|---|
| Monts P Witt | -- | None Available | |
| Monts P Witt | -- | None Available | |
| Monts P Witt | -- | North American Title Company | |
| Monts Paul W | -- | North American Title Company | |
| Monts P Witt | -- | None Available | |
| Monts P Witt | -- | None Available |
Source: Public Records
Mortgage History
| Date | Status | Borrower | Loan Amount |
|---|---|---|---|
| Closed | Monts Paul W | $190,000 |
Source: Public Records
Tax History
| Year | Tax Paid | Tax Assessment Tax Assessment Total Assessment is a certain percentage of the fair market value that is determined by local assessors to be the total taxable value of land and additions on the property. | Land | Improvement |
|---|---|---|---|---|
| 2025 | $7,220 | $302,217 | $169,038 | $140,179 |
| 2024 | $7,220 | $296,153 | $165,723 | $137,430 |
| 2023 | $6,990 | $297,210 | $162,474 | $134,736 |
| 2022 | $6,757 | $284,382 | $159,288 | $132,094 |
| 2021 | $6,740 | $278,670 | $156,166 | $129,504 |
| 2020 | $6,295 | $282,742 | $154,565 | $128,177 |
| 2019 | $5,946 | $277,199 | $151,535 | $125,664 |
| 2018 | $5,807 | $271,765 | $148,564 | $123,201 |
| 2017 | $5,587 | $266,436 | $145,651 | $120,785 |
| 2016 | $5,322 | $261,213 | $142,796 | $118,417 |
| 2015 | $5,231 | $257,289 | $140,651 | $116,638 |
| 2014 | $5,152 | $252,251 | $137,897 | $114,354 |
Source: Public Records
Map
Nearby Homes
- 1626 Hopkins St
- 1808 Cedar St
- 1425 Martin Luther King jr Way
- 1368 Rose St
- 1625 Martin Luther King jr Way
- 1609 Bonita Ave Unit 5
- 1610 Milvia St
- 1408 Henry St
- 1716 Hearst Ave
- 1813 Sacramento St
- 1509 Francis St
- 1411 Hearst Ave Unit 2
- 1322 Virginia St
- 1444 Walnut St
- 1950 Hopkins St
- 1631 Belvedere Ave
- 1120 Curtis St
- 1127 Key Route Blvd
- 1682 Oxford St
- 1515 Oxford St Unit 1D
Your Personal Tour Guide
Ask me questions while you tour the home.