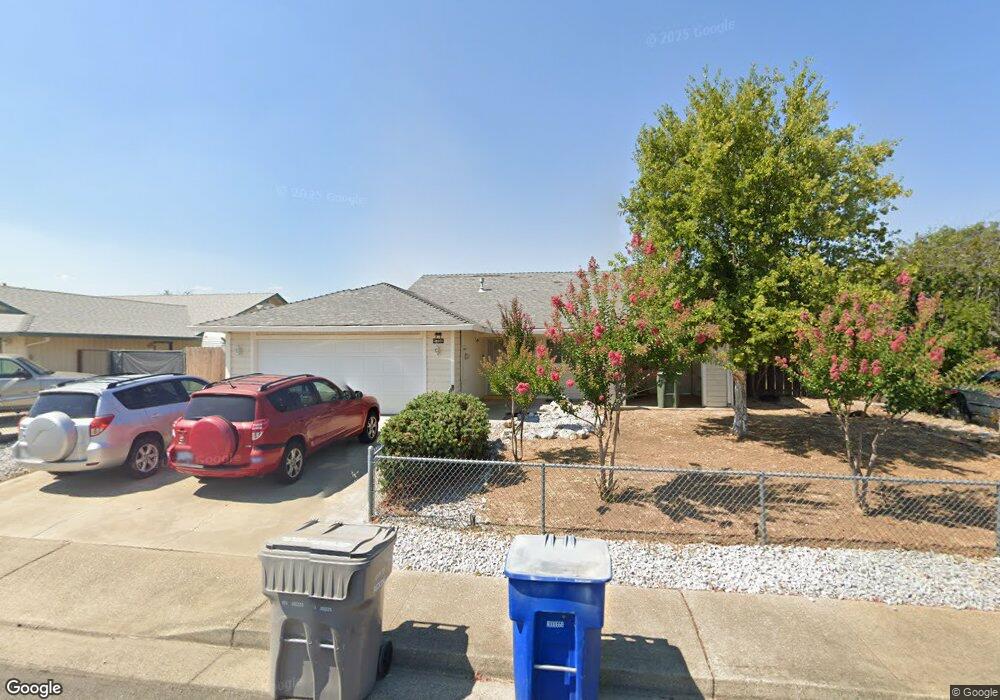
1708 Dakota Way Redding, CA 96003
Simpson University Region NeighborhoodEstimated Value: $363,632 - $423,000
3
Beds
2
Baths
1,627
Sq Ft
$240/Sq Ft
Est. Value
About This Home
This home is located at 1708 Dakota Way, Redding, CA 96003 and is currently estimated at $389,908, approximately $239 per square foot. 1708 Dakota Way is a home located in Shasta County with nearby schools including Columbia Elementary School, Mountain View Middle School, and Foothill High School.
Ownership History
Date
Name
Owned For
Owner Type
Purchase Details
Closed on
Dec 12, 2022
Sold by
Scroggins James E
Bought by
James E Scroggins Trust
Current Estimated Value
Purchase Details
Closed on
Jul 7, 2008
Sold by
Montgomery Joseph K and Montgomery Tanya M
Bought by
Scroggins James E and Scroggins Sharon
Home Financials for this Owner
Home Financials are based on the most recent Mortgage that was taken out on this home.
Original Mortgage
$231,267
Interest Rate
6.07%
Mortgage Type
FHA
Purchase Details
Closed on
Jun 26, 2000
Sold by
Hardisty Wm G Iii R L Trust
Bought by
Montgomery Joseph K and Montgomery Tanya M
Home Financials for this Owner
Home Financials are based on the most recent Mortgage that was taken out on this home.
Original Mortgage
$106,336
Interest Rate
8.67%
Mortgage Type
FHA
Create a Home Valuation Report for This Property
The Home Valuation Report is an in-depth analysis detailing your home's value as well as a comparison with similar homes in the area
Home Values in the Area
Average Home Value in this Area
Purchase History
We collect this data history from publicly available records. To have your information removed, we recommend requesting removal directly through your county’s website.
| Date | Buyer | Sale Price | Title Company |
|---|---|---|---|
| James E Scroggins Trust | -- | -- | |
| Scroggins James E | $235,000 | Fidelity Natl Title Co Of Ca | |
| Montgomery Joseph K | $106,500 | First American Title Co |
Source: Public Records
Mortgage History
We collect this data history from publicly available records. To have your information removed, we recommend requesting removal directly through your county’s website.
| Date | Status | Borrower | Loan Amount |
|---|---|---|---|
| Previous Owner | Scroggins James E | $231,267 | |
| Previous Owner | Montgomery Joseph K | $106,336 |
Source: Public Records
Tax History
| Year | Tax Paid | Tax Assessment Tax Assessment Total Assessment is a certain percentage of the fair market value that is determined by local assessors to be the total taxable value of land and additions on the property. | Land | Improvement |
|---|---|---|---|---|
| 2025 | $2,261 | $211,405 | $43,438 | $167,967 |
| 2024 | $2,267 | $207,261 | $42,587 | $164,674 |
| 2023 | $2,267 | $203,198 | $41,752 | $161,446 |
| 2022 | $2,184 | $199,215 | $40,934 | $158,281 |
| 2021 | $2,191 | $195,310 | $40,132 | $155,178 |
| 2020 | $2,154 | $193,308 | $39,721 | $153,587 |
| 2019 | $2,103 | $189,519 | $38,943 | $150,576 |
| 2018 | $2,139 | $185,804 | $38,180 | $147,624 |
| 2017 | $2,161 | $182,162 | $37,432 | $144,730 |
| 2016 | $2,025 | $178,592 | $36,699 | $141,893 |
| 2015 | $1,993 | $175,910 | $36,148 | $139,762 |
| 2014 | $1,938 | $172,465 | $35,440 | $137,025 |
Source: Public Records
Map
Nearby Homes
- 1720 Stetson Way
- 140 Danbury Dr
- 1363 College View Dr
- 274 Franciscan Trail
- 19226 Snowburst Ct
- 332 Franciscan Trail
- 282 Buckhorn Walk
- 655 Mammoth Path
- 647 Olympic St
- 2192 Princeton Way
- 2199 Princeton Way
- 542 El Mango Dr
- 1102 Golden Gate Trail
- 11539 Vista Del Rio
- 19331 Hollow Ln
- 11456 Wales Dr
- 2110 Cadjew St
- 2134 Cadjew St
- 2142 Cadjew St
- 2182 Cadjew St
- 1684 Dakota Way
- 1670 Dakota Way
- 1681 Stetson Way
- 1722 Dakota Way
- 1668 Dakota Way
- 1703 Dakota Way
- 1691 Stetson Way
- 1657 Dakota Way
- 1734 Dakota Way
- 1715 Dakota Way
- 1646 Dakota Way
- 1717 Stetson Way
- 1727 Dakota Way
- 1635 Dakota Way
- 1686 Stetson Way
- 1746 Dakota Way
- 1624 Dakota Way
- 129 Justin Way Unit 1
- 129 Justin Way
- 1737 Stetson Way
Your Personal Tour Guide
Ask me questions while you tour the home.