Estimated Value: $821,691 - $937,000
3
Beds
4
Baths
2,247
Sq Ft
$392/Sq Ft
Est. Value
About This Home
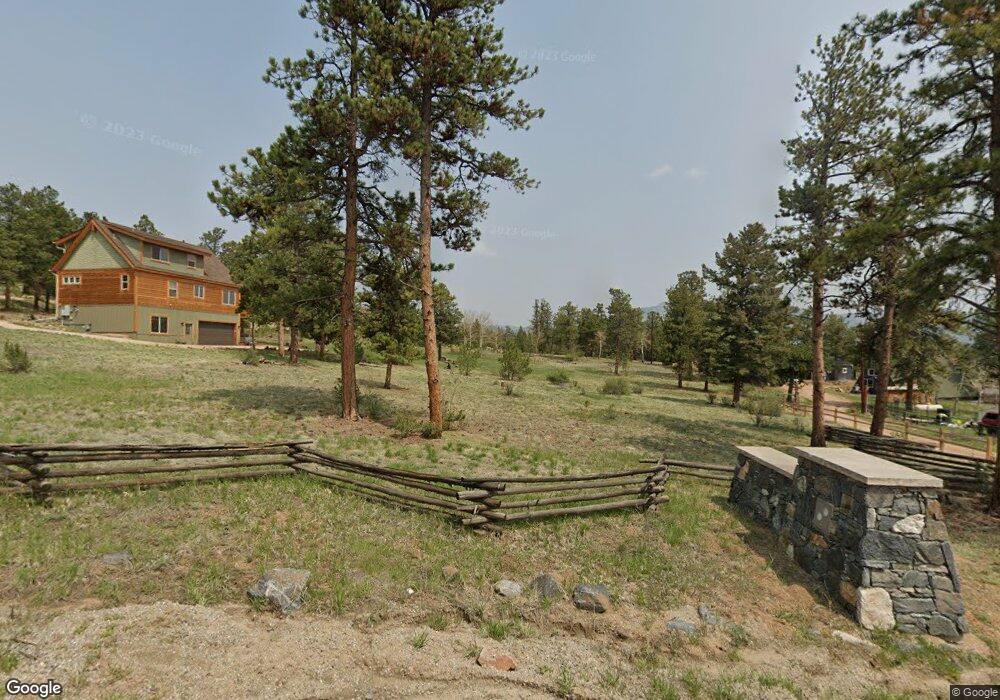
This home is located at 171 Mohawk Trail, Pine, CO 80470 and is currently estimated at $881,173, approximately $392 per square foot. 171 Mohawk Trail is a home located in Park County with nearby schools including Deer Creek Elementary School, Fitzsimmons Middle School, and Platte Canyon High School.
Ownership History
Date
Name
Owned For
Owner Type
Purchase Details
Closed on
Oct 7, 2019
Sold by
Hofland Nels Lawrence and Hofland Chelsea Gamble
Bought by
Michael J Ferraro and Ferraro Li Deborah M
Current Estimated Value
Purchase Details
Closed on
Feb 26, 2016
Sold by
Quercioli Leonard
Bought by
Hofland Nels Lawrence and Hofland Chelsea Gamble
Home Financials for this Owner
Home Financials are based on the most recent Mortgage that was taken out on this home.
Original Mortgage
$366,200
Interest Rate
3.81%
Mortgage Type
New Conventional
Purchase Details
Closed on
Dec 12, 2014
Sold by
Lion S Head Ranch Llc
Bought by
Quercioli Leonard
Home Financials for this Owner
Home Financials are based on the most recent Mortgage that was taken out on this home.
Original Mortgage
$281,140
Interest Rate
5.5%
Mortgage Type
Construction
Create a Home Valuation Report for This Property
The Home Valuation Report is an in-depth analysis detailing your home's value as well as a comparison with similar homes in the area
Home Values in the Area
Average Home Value in this Area
Purchase History
| Date | Buyer | Sale Price | Title Company |
|---|---|---|---|
| Michael J Ferraro | $590,000 | Chicago Title | |
| Hofland Nels Lawrence | $457,750 | Chicago Title Co | |
| Quercioli Leonard | $49,500 | Fidelity National Title Ins |
Source: Public Records
Mortgage History
| Date | Status | Borrower | Loan Amount |
|---|---|---|---|
| Previous Owner | Hofland Nels Lawrence | $366,200 | |
| Previous Owner | Quercioli Leonard | $281,140 |
Source: Public Records
Tax History
| Year | Tax Paid | Tax Assessment Tax Assessment Total Assessment is a certain percentage of the fair market value that is determined by local assessors to be the total taxable value of land and additions on the property. | Land | Improvement |
|---|---|---|---|---|
| 2025 | $3,284 | $52,780 | $14,750 | $38,030 |
| 2024 | $3,068 | $53,450 | $15,550 | $37,900 |
| 2023 | $3,068 | $53,450 | $15,550 | $37,900 |
| 2022 | $2,471 | $40,429 | $9,541 | $30,888 |
| 2021 | $2,463 | $41,600 | $9,820 | $31,780 |
| 2020 | $2,370 | $38,420 | $7,780 | $30,640 |
| 2019 | $2,276 | $38,420 | $7,780 | $30,640 |
| 2018 | $1,969 | $39,470 | $7,780 | $31,690 |
| 2017 | $1,966 | $34,030 | $7,540 | $26,490 |
| 2016 | $2,156 | $37,140 | $3,450 | $33,690 |
| 2015 | $191 | $3,250 | $3,250 | $0 |
| 2014 | $803 | $0 | $0 | $0 |
Source: Public Records
Map
Nearby Homes
- 229 Mohawk Trail
- 249 Territory Dr Unit 4
- 34657 Mohawk Trail
- 2565 S Nova Rd
- 13347 S Otoe St
- 13287 S Otoe St
- 191 Diamond Dr
- 102 Carmargo Rd
- 34697 Silver Springs Blvd
- 34431 Chilton Ave
- 13851 Pine Valley Rd
- 65 Silver Springs Rd
- 38 Buttermilk Ln
- 1819 Nova Rd Unit 4
- 12907 S Cindy Ave
- 121 Sunlight Ln
- 212 Wisp Creek Dr
- 33988 Jenifer Rd
- 14034 S Wandcrest Dr
- 33626 Lutes Rd
- 101 Mohawk Trail
- 81 Mohawk Trail
- 230 Mohawk Trail
- 71 Mohawk Trail
- 145 Navajo Trail
- 121 Navajo Trail
- 673 Mount Evans Blvd
- 95 Navajo Trail
- 38 Mohawk Trail
- 28 Mohawk Trail
- 150 Navajo Trail
- 567 Mount Evans Blvd
- 247 Mohawk Trail
- 290 Mohawk Trail
- 26 Mohawk Trail
- 71 Navajo Trail
- 309 Mohawk Trail
- 57 Navajo Trail
- 18 Mohawk Trail
- 173 Pima Trail
Your Personal Tour Guide
Ask me questions while you tour the home.