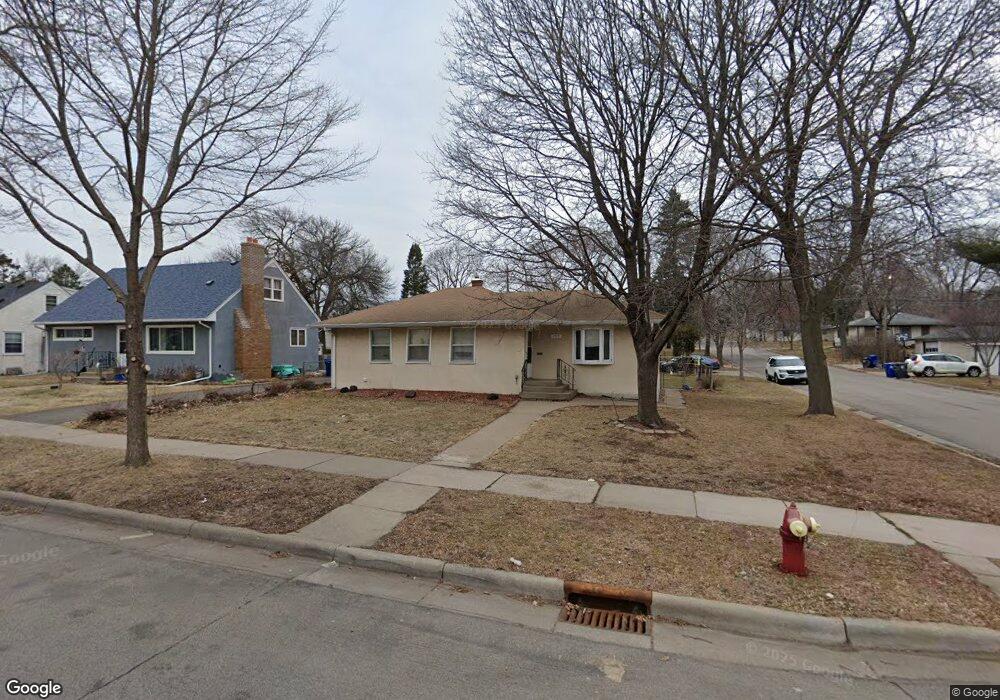
1715 1715 Idaho-Avenue-e St. Paul, MN 55106
Prosperity Heights NeighborhoodEstimated Value: $301,000 - $322,058
3
Beds
2
Baths
141
Sq Ft
$2,204/Sq Ft
Est. Value
About This Home
This home is located at 1715 1715 Idaho-Avenue-e, St. Paul, MN 55106 and is currently estimated at $310,765, approximately $2,204 per square foot. 1715 1715 Idaho-Avenue-e is a home located in Ramsey County with nearby schools including Frost Lake Elementary School, Txuj Ci HMong Language and Culture Upper Campus, and Johnson Senior High School.
Ownership History
Date
Name
Owned For
Owner Type
Purchase Details
Closed on
Sep 18, 2020
Sold by
Her Pa K and Xiong Saeng
Bought by
Wai Lah
Current Estimated Value
Home Financials for this Owner
Home Financials are based on the most recent Mortgage that was taken out on this home.
Original Mortgage
$217,800
Outstanding Balance
$192,925
Interest Rate
2.8%
Mortgage Type
New Conventional
Estimated Equity
$117,840
Purchase Details
Closed on
Mar 18, 2014
Sold by
Charles J Nosie Inc
Bought by
Her Pa K and Xiong Saeng
Home Financials for this Owner
Home Financials are based on the most recent Mortgage that was taken out on this home.
Original Mortgage
$175,000
Interest Rate
4.37%
Purchase Details
Closed on
Oct 9, 2013
Purchase Details
Closed on
Apr 28, 2000
Sold by
Estate Of Thomas P Jones
Bought by
Comer Michael J and Comer Patricia M
Create a Home Valuation Report for This Property
The Home Valuation Report is an in-depth analysis detailing your home's value as well as a comparison with similar homes in the area
Home Values in the Area
Average Home Value in this Area
Purchase History
| Date | Buyer | Sale Price | Title Company |
|---|---|---|---|
| Wai Lah | $242,000 | Titlesmart Inc | |
| Her Pa K | $180,303 | Guaranty Title Inc | |
| Her Pa Pa | $175,000 | -- | |
| -- | $76,000 | -- | |
| Comer Michael J | $124,900 | -- |
Source: Public Records
Mortgage History
| Date | Status | Borrower | Loan Amount |
|---|---|---|---|
| Open | Wai Lah | $217,800 | |
| Previous Owner | Her Pa Pa | $175,000 | |
| Previous Owner | Her Pa K | $171,804 |
Source: Public Records
Tax History Compared to Growth
Tax History
| Year | Tax Paid | Tax Assessment Tax Assessment Total Assessment is a certain percentage of the fair market value that is determined by local assessors to be the total taxable value of land and additions on the property. | Land | Improvement |
|---|---|---|---|---|
| 2025 | $4,482 | $319,400 | $30,000 | $289,400 |
| 2023 | $4,482 | $296,100 | $25,000 | $271,100 |
| 2022 | $3,892 | $291,600 | $25,000 | $266,600 |
| 2021 | $3,674 | $250,900 | $25,000 | $225,900 |
| 2020 | $3,318 | $233,600 | $26,700 | $206,900 |
| 2019 | $3,368 | $207,700 | $26,700 | $181,000 |
| 2018 | $3,136 | $201,600 | $26,700 | $174,900 |
| 2017 | $2,746 | $195,100 | $26,700 | $168,400 |
| 2016 | $2,524 | $0 | $0 | $0 |
| 2015 | $2,244 | $150,600 | $26,700 | $123,900 |
| 2014 | $2,932 | $0 | $0 | $0 |
Source: Public Records
Map
Nearby Homes
- 1740 California Ave E
- 1637 Iowa Ave E
- 1627 Christie Place
- 1676 Montana Ave E
- 1607 Hoyt Ave E
- 1743 White Bear Ave N
- 1840 Iowa Ave E
- 1840 Hoyt Ave E
- 1696 Nevada Ave E
- 1844 Montana Ave E
- 1874 Hoyt Ave E
- 1698 Arlington Ave E
- 1644 Arlington Ave E
- 1729 Sherwood Ave
- 1856 Flandrau St
- 1905 Montana Ave E
- 1828 Arlington Ave E
- 1849 Kennard St
- 1806 Sherwood Ave
- 1672 Manton St
- 1715 Idaho Ave E
- 1711 Idaho Ave E
- 1705 Idaho Ave E
- 1719 Idaho Ave E
- 1725 Idaho Ave E
- 1716 California Ave E
- 1716 Idaho Ave E
- 1712 Idaho Ave E
- 1701 Idaho Ave E
- 1710 California Ave E
- 1710 1710 California-Avenue-e
- 1708 Idaho Ave E
- 1706 California Ave E
- 1722 California Ave E
- 1704 Idaho Ave E
- 1731 Idaho Ave E
- 1697 Idaho Ave E
- 1700 California Ave E
- 1726 California Ave E
- 1700 Idaho Ave E