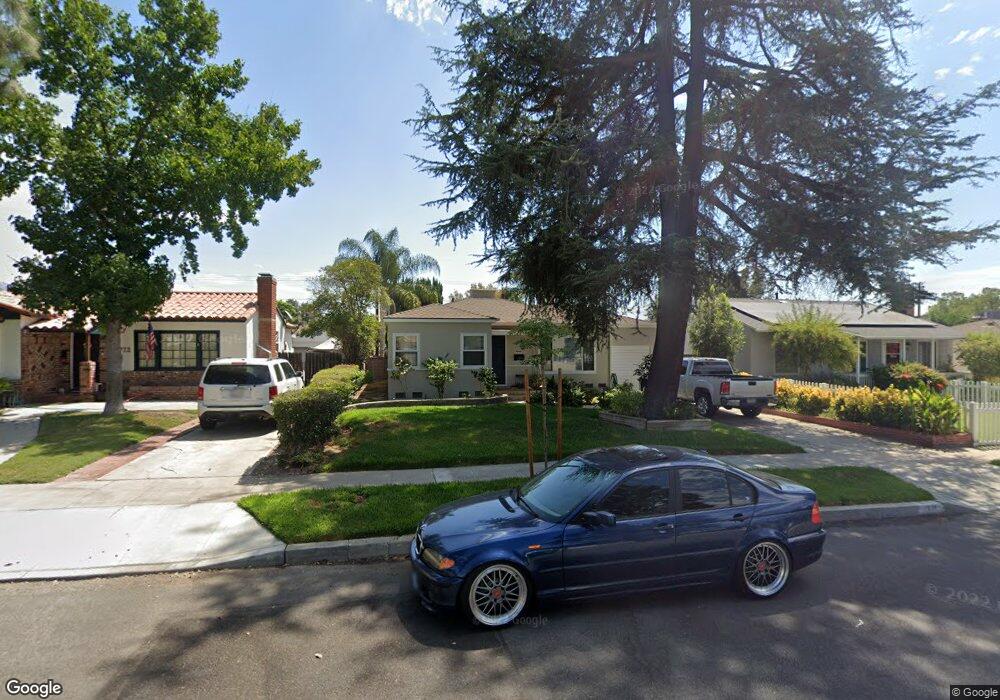
1718 N Pass Ave Burbank, CA 91505
Northwest District NeighborhoodEstimated Value: $1,014,000 - $1,352,000
3
Beds
2
Baths
2,082
Sq Ft
$555/Sq Ft
Est. Value
About This Home
This home is located at 1718 N Pass Ave, Burbank, CA 91505 and is currently estimated at $1,155,668, approximately $555 per square foot. 1718 N Pass Ave is a home located in Los Angeles County with nearby schools including Bret Harte Elementary School, Luther Burbank Middle School, and John Burroughs High School.
Ownership History
Date
Name
Owned For
Owner Type
Purchase Details
Closed on
Jul 6, 2005
Sold by
Rode Richard F
Bought by
Rode Richard F and Rode Niem Tran Di
Current Estimated Value
Home Financials for this Owner
Home Financials are based on the most recent Mortgage that was taken out on this home.
Original Mortgage
$450,000
Interest Rate
5.55%
Mortgage Type
New Conventional
Purchase Details
Closed on
Dec 10, 2003
Sold by
Brander James S and Valento Juliette M
Bought by
Rode Richard F
Home Financials for this Owner
Home Financials are based on the most recent Mortgage that was taken out on this home.
Original Mortgage
$330,000
Interest Rate
1.75%
Mortgage Type
Purchase Money Mortgage
Create a Home Valuation Report for This Property
The Home Valuation Report is an in-depth analysis detailing your home's value as well as a comparison with similar homes in the area
Home Values in the Area
Average Home Value in this Area
Purchase History
| Date | Buyer | Sale Price | Title Company |
|---|---|---|---|
| Rode Richard F | -- | United Title Co San Diego | |
| Rode Richard F | $193,000 | Equity Title |
Source: Public Records
Mortgage History
| Date | Status | Borrower | Loan Amount |
|---|---|---|---|
| Closed | Rode Richard F | $450,000 | |
| Closed | Rode Richard F | $330,000 |
Source: Public Records
Tax History
| Year | Tax Paid | Tax Assessment Tax Assessment Total Assessment is a certain percentage of the fair market value that is determined by local assessors to be the total taxable value of land and additions on the property. | Land | Improvement |
|---|---|---|---|---|
| 2025 | $5,425 | $485,993 | $422,612 | $63,381 |
| 2024 | $5,425 | $476,465 | $414,326 | $62,139 |
| 2023 | $5,367 | $467,123 | $406,202 | $60,921 |
| 2022 | $5,125 | $457,965 | $398,238 | $59,727 |
| 2021 | $5,095 | $448,986 | $390,430 | $58,556 |
| 2020 | $5,038 | $444,383 | $386,427 | $57,956 |
| 2019 | $4,890 | $435,670 | $378,850 | $56,820 |
| 2018 | $4,804 | $427,128 | $371,422 | $55,706 |
| 2016 | $4,545 | $410,544 | $357,000 | $53,544 |
| 2015 | $4,453 | $404,378 | $351,638 | $52,740 |
| 2014 | $4,444 | $396,457 | $344,750 | $51,707 |
Source: Public Records
Map
Nearby Homes
- 1741 N Rose St
- 1902 N Pass Ave
- 1809 N Rose St
- 1918 N Maple St
- 1903 N Screenland Dr
- 1910 N Rose St
- 1817 N Hollywood Way
- 1920 N Screenland Dr
- 1511 N Maple St
- 1516 N Pepper St
- 1505 N Rose St
- 3621 W Victory Blvd
- 1423 N Hollywood Way
- 1415 N Screenland Dr
- 2016 N Screenland Dr
- 11214 W Victory Blvd Unit 6
- 6149 Auckland Ave
- 11224 W Victory Blvd
- 2115 N Pass
- 2117 N Screenland Dr
- 1722 N Pass Ave
- 1714 N Pass Ave
- 1726 N Pass Ave
- 1710 N Pass Ave
- 1721 N Maple St
- 1717 N Maple St
- 1723 N Maple St
- 1730 N Pass Ave
- 1706 N Pass Ave
- 1727 N Maple St
- 1711 N Maple St
- 1719 N Pass Ave
- 1723 N Pass Ave
- 1715 N Pass Ave
- 1731 N Maple St
- 1705 N Maple St
- 1702 N Pass Ave
- 1711 N Pass Ave
- 1727 N Pass Ave
- 1735 N Maple St
Your Personal Tour Guide
Ask me questions while you tour the home.