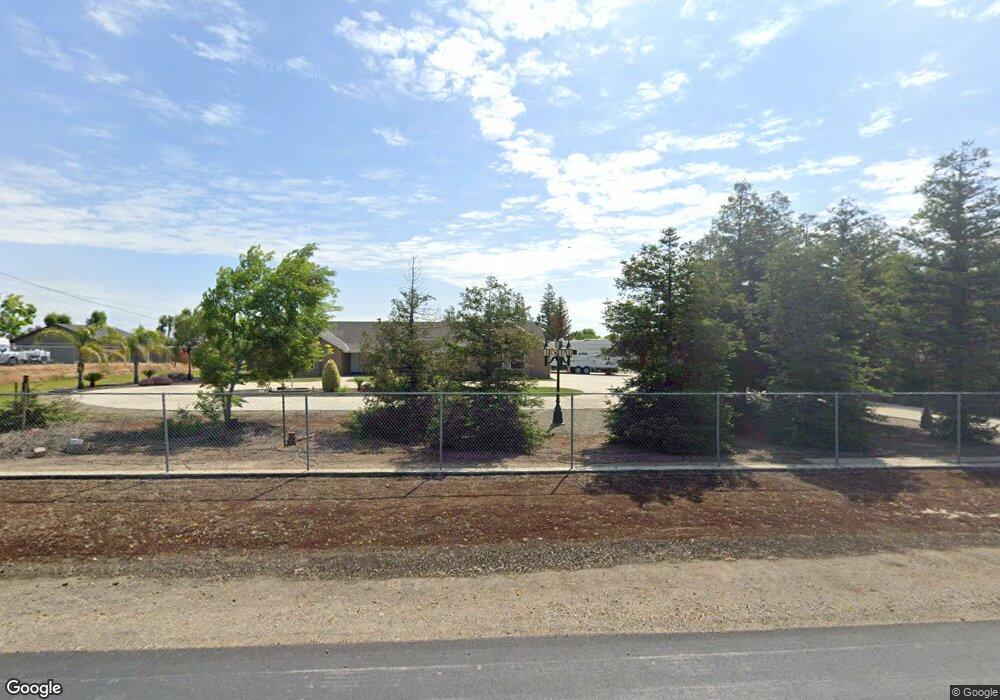
17195 Monreal Rd Madera, CA 93636
Estimated Value: $513,000 - $714,000
4
Beds
3
Baths
2,492
Sq Ft
$264/Sq Ft
Est. Value
About This Home
This home is located at 17195 Monreal Rd, Madera, CA 93636 and is currently estimated at $657,665, approximately $263 per square foot. 17195 Monreal Rd is a home located in Madera County with nearby schools including Sierra View Elementary School, Ranchos Middle School, and Liberty High School.
Ownership History
Date
Name
Owned For
Owner Type
Purchase Details
Closed on
Apr 8, 2025
Sold by
Barnes James M and Barnes Regina
Bought by
James M Barnes And Regina Barnes Revocable Tr and Barnes
Current Estimated Value
Purchase Details
Closed on
Oct 9, 2000
Sold by
Thiessen Simon and Thiessen Dorothy
Bought by
Barnes James M and Barnes Regina
Home Financials for this Owner
Home Financials are based on the most recent Mortgage that was taken out on this home.
Original Mortgage
$6,000
Interest Rate
7.9%
Purchase Details
Closed on
Jul 1, 2000
Sold by
Newkirk Delano L
Bought by
Thiessen Simon and Thiessen Dorothy
Home Financials for this Owner
Home Financials are based on the most recent Mortgage that was taken out on this home.
Original Mortgage
$66,000
Interest Rate
8.37%
Mortgage Type
Seller Take Back
Create a Home Valuation Report for This Property
The Home Valuation Report is an in-depth analysis detailing your home's value as well as a comparison with similar homes in the area
Home Values in the Area
Average Home Value in this Area
Purchase History
| Date | Buyer | Sale Price | Title Company |
|---|---|---|---|
| James M Barnes And Regina Barnes Revocable Tr | -- | None Listed On Document | |
| Barnes James M | $34,000 | Chicago Title Co | |
| Thiessen Simon | $96,000 | Chicago Title Co |
Source: Public Records
Mortgage History
| Date | Status | Borrower | Loan Amount |
|---|---|---|---|
| Previous Owner | Barnes James M | $6,000 | |
| Previous Owner | Thiessen Simon | $66,000 |
Source: Public Records
Tax History
| Year | Tax Paid | Tax Assessment Tax Assessment Total Assessment is a certain percentage of the fair market value that is determined by local assessors to be the total taxable value of land and additions on the property. | Land | Improvement |
|---|---|---|---|---|
| 2025 | $4,445 | $411,747 | $55,403 | $356,344 |
| 2024 | $4,445 | $403,674 | $54,317 | $349,357 |
| 2023 | $4,445 | $395,759 | $53,252 | $342,507 |
| 2022 | $4,313 | $388,000 | $52,208 | $335,792 |
| 2021 | $4,189 | $380,393 | $51,185 | $329,208 |
| 2020 | $4,346 | $376,494 | $50,661 | $325,833 |
| 2019 | $4,179 | $369,113 | $49,668 | $319,445 |
| 2018 | $4,076 | $361,877 | $48,695 | $313,182 |
| 2017 | $4,061 | $354,783 | $47,741 | $307,042 |
| 2016 | $3,955 | $347,827 | $46,805 | $301,022 |
| 2015 | $3,951 | $342,603 | $46,102 | $296,501 |
| 2014 | $3,806 | $335,892 | $45,199 | $290,693 |
Source: Public Records
Map
Nearby Homes
- 16861 Paula Rd
- 36768 Verde Ave
- 16564 Karen Rd
- 37055 Avenue 17 1 2
- 16448 Monreal Rd
- 16389 Monreal Rd
- 16363 Paula Rd
- 16601 La Canada Rd
- 17063 Anaconda Rd
- 9999 Anaconda Rd
- 37216 Highway 145
- 16026 Karen Rd
- 37491 Verde Ave
- 0 Avenue 16 Unit 634825
- 0 Avenue 16 Unit 634646
- 36634 Avenue 16
- 37647 Verde Ave
- 37143 Avenue 16
- 37795 Avenue 17
- 1106 Significant Way W
- 17157 Monreal Rd
- 17233 Monreal Rd
- 17113 Monreal Rd
- 17269 Monreal Rd
- 17156 Karen Rd
- 17194 Karen Rd
- 17156 Monreal Rd
- 17232 Monreal Rd
- 17270 Karen Rd
- 17076 Karen Rd
- 17307 Monreal Rd
- 17308 Karen Rd
- 17270 Monreal Rd
- 17112 Monreal Rd
- 17195 Karen Rd
- 17100 Karen Rd
- 17308 Monreal Rd
- 17345 Monreal Rd
- 17157 Karen Rd
Your Personal Tour Guide
Ask me questions while you tour the home.