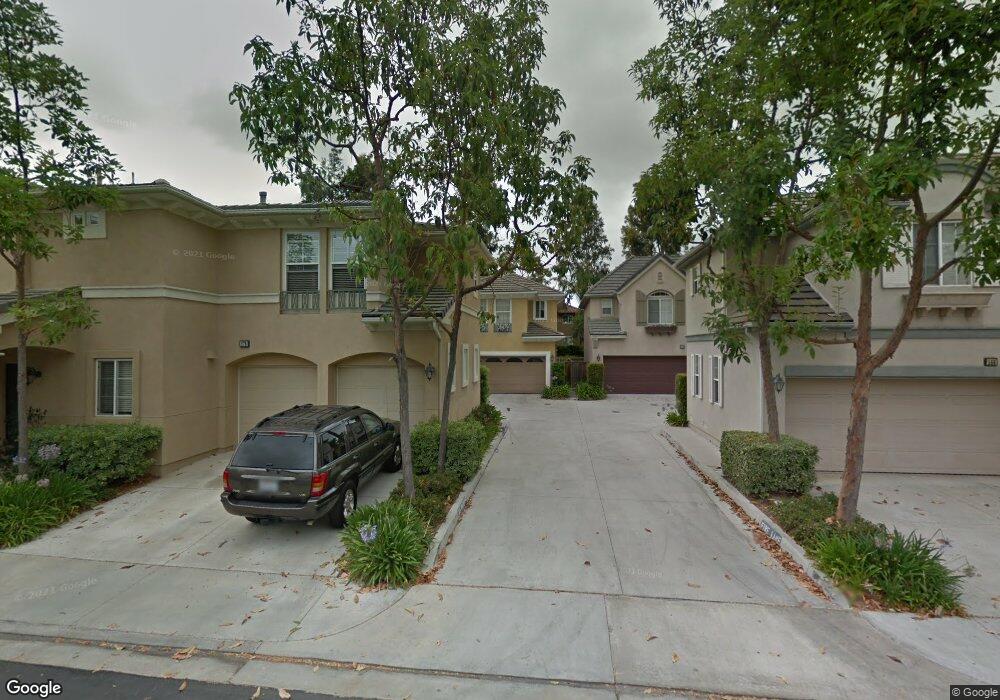
172 Cherrybrook Ln Unit 81 Irvine, CA 92618
Oak Creek NeighborhoodEstimated Value: $979,462 - $1,305,000
2
Beds
2
Baths
1,166
Sq Ft
$972/Sq Ft
Est. Value
About This Home
This home is located at 172 Cherrybrook Ln Unit 81, Irvine, CA 92618 and is currently estimated at $1,133,366, approximately $972 per square foot. 172 Cherrybrook Ln Unit 81 is a home located in Orange County with nearby schools including Oak Creek Elementary, Lakeside Middle School, and Woodbridge High School.
Ownership History
Date
Name
Owned For
Owner Type
Purchase Details
Closed on
Dec 27, 2012
Sold by
Galkin George J and Galkin Barbara A
Bought by
Galkin George J and Galkin Barbara A
Current Estimated Value
Purchase Details
Closed on
Jun 15, 2001
Sold by
Galkin George J and Galkin Barbara A
Bought by
Galkin George J and Galkin Barbara A
Purchase Details
Closed on
Mar 5, 1999
Sold by
Wl Homes Llc
Bought by
Galkin George J and Galkin Barbara A
Home Financials for this Owner
Home Financials are based on the most recent Mortgage that was taken out on this home.
Original Mortgage
$171,200
Interest Rate
6.86%
Create a Home Valuation Report for This Property
The Home Valuation Report is an in-depth analysis detailing your home's value as well as a comparison with similar homes in the area
Home Values in the Area
Average Home Value in this Area
Purchase History
| Date | Buyer | Sale Price | Title Company |
|---|---|---|---|
| Galkin George J | -- | None Available | |
| Galkin George J | -- | First American Title Co | |
| Galkin George J | $214,500 | First American Title Ins Co |
Source: Public Records
Mortgage History
| Date | Status | Borrower | Loan Amount |
|---|---|---|---|
| Previous Owner | Galkin George J | $171,200 | |
| Closed | Galkin George J | $32,100 |
Source: Public Records
Tax History Compared to Growth
Tax History
| Year | Tax Paid | Tax Assessment Tax Assessment Total Assessment is a certain percentage of the fair market value that is determined by local assessors to be the total taxable value of land and additions on the property. | Land | Improvement |
|---|---|---|---|---|
| 2025 | $3,558 | $335,476 | $139,329 | $196,147 |
| 2024 | $3,558 | $328,899 | $136,598 | $192,301 |
| 2023 | $3,464 | $322,450 | $133,919 | $188,531 |
| 2022 | $3,392 | $316,128 | $131,293 | $184,835 |
| 2021 | $3,311 | $309,930 | $128,719 | $181,211 |
| 2020 | $3,292 | $306,753 | $127,400 | $179,353 |
| 2019 | $3,840 | $300,739 | $124,902 | $175,837 |
| 2018 | $3,781 | $294,843 | $122,453 | $172,390 |
| 2017 | $3,714 | $289,062 | $120,052 | $169,010 |
| 2016 | $3,580 | $283,395 | $117,698 | $165,697 |
| 2015 | $3,536 | $279,139 | $115,930 | $163,209 |
| 2014 | $3,480 | $273,672 | $113,660 | $160,012 |
Source: Public Records
Map
Nearby Homes
- 52 Danbury Ln
- 29 Poppy Unit 49
- 811 Larkridge
- 3 Birchwood
- 410 E Yale Loop
- 37 Pheasant Creek
- 549 Springbrook N
- 352 Fallingstar Unit 57
- 619 Springbrook N
- 11 Fallingstar
- 43 Glenhurst
- 5 Fernbank
- 226 Greenmoor Unit 95
- 80 Greenmoor Unit 40
- 25 Tangelo Unit 292
- 10 Glenhurst Unit 37
- 45 Shearwater
- 4 Dogwood N
- 7201 Apricot Dr
- 268 Lemon Grove
- 170 Cherrybrook Ln
- 174 Cherrybrook Ln
- 176 Cherrybrook Ln Unit 79
- 168 Cherrybrook Ln
- 180 Cherrybrook Ln
- 166 Cherrybrook Ln
- 182 Cherrybrook Ln
- 178 Cherrybrook Ln
- 162 Cherrybrook Ln
- 411 Sonoma Aisle
- 164 Cherrybrook Ln Unit 85
- 184 Cherrybrook Ln
- 160 Cherrybrook Ln
- 167 Cherrybrook Ln Unit 29
- 177 Cherrybrook Ln Unit 34
- 188 Cherrybrook Ln Unit 73
- 186 Cherrybrook Ln Unit 1
- 186 Cherrybrook Ln
- 158 Cherrybrook Ln
- 165 Cherrybrook Ln