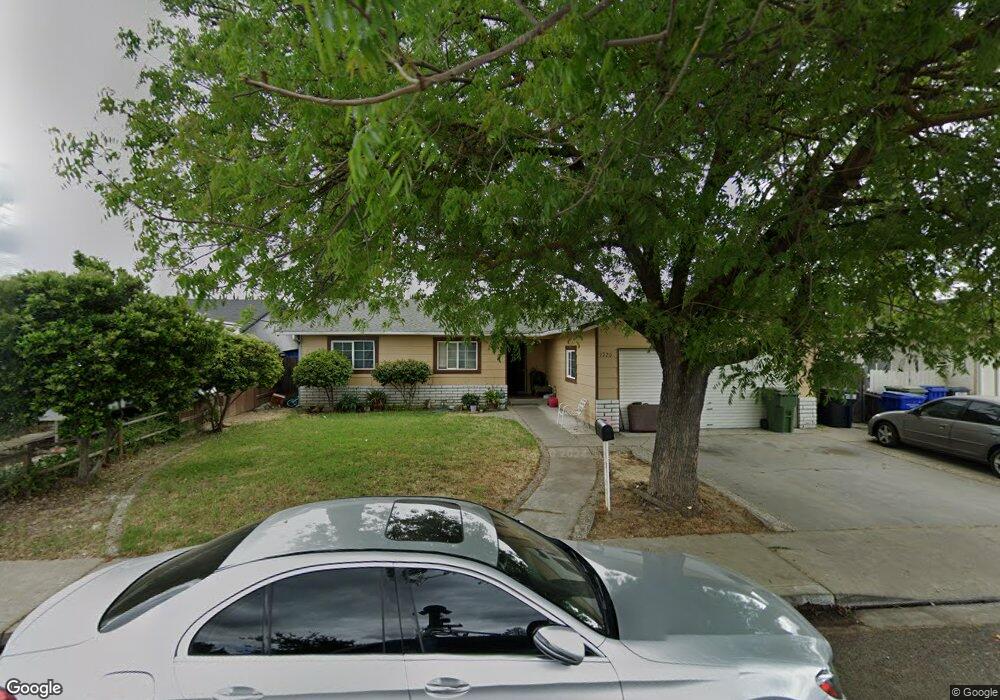
1720 Blevins Ct Turlock, CA 95380
Estimated Value: $216,000 - $422,000
3
Beds
2
Baths
1,244
Sq Ft
$295/Sq Ft
Est. Value
About This Home
This home is located at 1720 Blevins Ct, Turlock, CA 95380 and is currently estimated at $367,363, approximately $295 per square foot. 1720 Blevins Ct is a home located in Stanislaus County with nearby schools including Crowell Elementary School, Marvin A. Dutcher Middle School, and Turlock Junior High School.
Ownership History
Date
Name
Owned For
Owner Type
Purchase Details
Closed on
Jan 17, 2020
Sold by
Mota Carmen Maria and Padilla Carmen M
Bought by
Mota Carmen Maria
Current Estimated Value
Purchase Details
Closed on
Aug 13, 2005
Sold by
Padilla Santiago
Bought by
Padilla Carmen M
Purchase Details
Closed on
Dec 13, 2001
Sold by
Padilla Carmen M and Calderon Carmen
Bought by
Padilla Santiago and Padilla Carmen M
Home Financials for this Owner
Home Financials are based on the most recent Mortgage that was taken out on this home.
Original Mortgage
$81,600
Interest Rate
6.73%
Purchase Details
Closed on
Aug 16, 1996
Sold by
Reis Joe Gregory and Reis Laura
Bought by
Calderon Carmen
Home Financials for this Owner
Home Financials are based on the most recent Mortgage that was taken out on this home.
Original Mortgage
$81,800
Interest Rate
8.2%
Mortgage Type
FHA
Create a Home Valuation Report for This Property
The Home Valuation Report is an in-depth analysis detailing your home's value as well as a comparison with similar homes in the area
Home Values in the Area
Average Home Value in this Area
Purchase History
| Date | Buyer | Sale Price | Title Company |
|---|---|---|---|
| Mota Carmen Maria | -- | None Available | |
| Padilla Carmen M | -- | -- | |
| Padilla Santiago | -- | Fidelity National Title Co | |
| Calderon Carmen | $100,000 | Chicago Title Co |
Source: Public Records
Mortgage History
| Date | Status | Borrower | Loan Amount |
|---|---|---|---|
| Previous Owner | Padilla Santiago | $81,600 | |
| Previous Owner | Calderon Carmen | $81,800 |
Source: Public Records
Tax History Compared to Growth
Tax History
| Year | Tax Paid | Tax Assessment Tax Assessment Total Assessment is a certain percentage of the fair market value that is determined by local assessors to be the total taxable value of land and additions on the property. | Land | Improvement |
|---|---|---|---|---|
| 2025 | $1,675 | $162,847 | $48,850 | $113,997 |
| 2024 | $1,642 | $159,655 | $47,893 | $111,762 |
| 2023 | $1,638 | $156,525 | $46,954 | $109,571 |
| 2022 | $1,616 | $153,457 | $46,034 | $107,423 |
| 2021 | $1,591 | $150,449 | $45,132 | $105,317 |
| 2020 | $1,579 | $148,908 | $44,670 | $104,238 |
| 2019 | $1,551 | $145,990 | $43,795 | $102,195 |
| 2018 | $1,548 | $143,129 | $42,937 | $100,192 |
| 2017 | $1,511 | $140,324 | $42,096 | $98,228 |
| 2016 | $1,409 | $137,573 | $41,271 | $96,302 |
| 2015 | $1,396 | $135,508 | $40,652 | $94,856 |
| 2014 | $1,381 | $132,854 | $39,856 | $92,998 |
Source: Public Records
Map
Nearby Homes
- 1400 N Tully Rd Unit 173
- 1400 N Tully Rd Unit 187
- 1357 Mark Ct
- 842 Lazarine Ct
- 2400 Fulkerth Rd
- 2450 Fulkerth Rd
- 981 Countryside Dr
- 1228 Magic Sands Way
- 2226 Typhoon Ct
- 1043 Chestnut St
- 500 N Tully Rd Unit 39
- 500 N Tully Rd Unit 110
- 900 W Canal Dr Unit 100
- 2631 Polous Dr
- 2101 State St
- 2391 Typhoon Dr
- 504 Allen Way
- 2213 Dels Ln
- 2300 Dels Ln
- 425 20th Century Blvd Unit D17
- 1740 Blevins Ct
- 1710 Blevins Ct
- 1760 Blevins Ct
- 1700 Blevins Ct
- 1721 Blevins Ct
- 1741 Blevins Ct
- 1701 Blevins Ct
- 1780 Blevins Ct
- 1761 Blevins Ct
- 1690 Blevins Way
- 1781 Blevins Ct
- 1365 Tawny Ln
- 1800 Blevins Ct
- 1720 Lial Ct
- 1345 Tawny Ln
- 1740 Lial Ct
- 1700 Lial Ct
- 1440 Edgewater Dr
- 1680 Blevins Way
- 1801 Blevins Ct