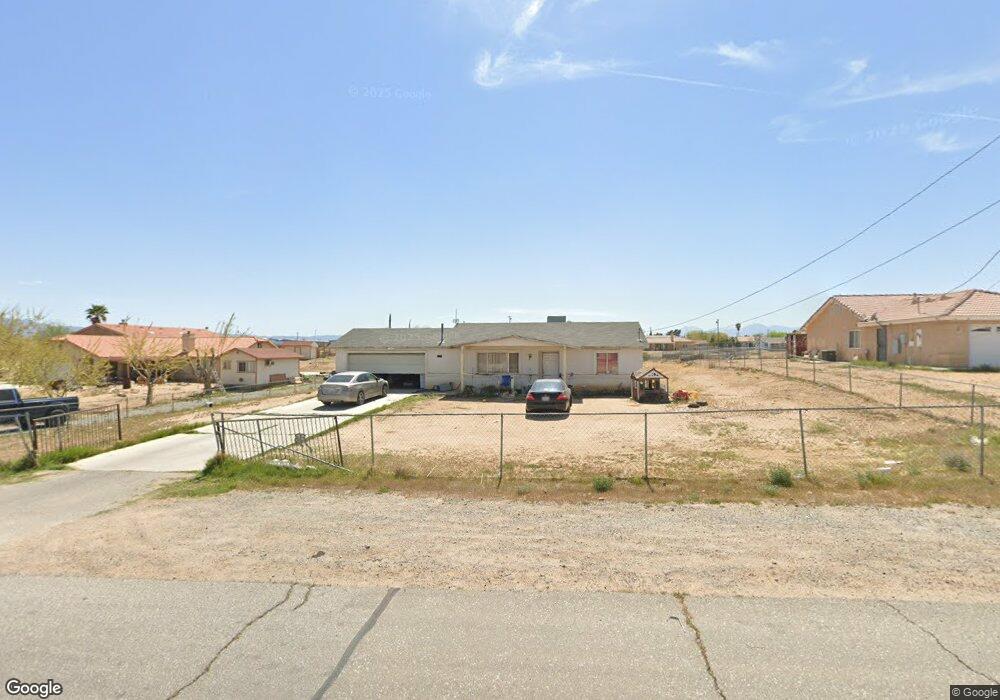
17219 Birch St Hesperia, CA 92345
Estimated Value: $286,000 - $367,000
2
Beds
1
Bath
972
Sq Ft
$340/Sq Ft
Est. Value
About This Home
This home is located at 17219 Birch St, Hesperia, CA 92345 and is currently estimated at $330,375, approximately $339 per square foot. 17219 Birch St is a home located in San Bernardino County with nearby schools including Eucalyptus Elementary School, Hesperia Junior High School, and Hesperia High School.
Ownership History
Date
Name
Owned For
Owner Type
Purchase Details
Closed on
Dec 5, 2017
Sold by
Sanchez Cesar L
Bought by
Sanchez Cesar L and Schell Kristy
Current Estimated Value
Home Financials for this Owner
Home Financials are based on the most recent Mortgage that was taken out on this home.
Original Mortgage
$120,000
Outstanding Balance
$101,030
Interest Rate
3.94%
Mortgage Type
New Conventional
Estimated Equity
$229,346
Purchase Details
Closed on
Sep 25, 1996
Sold by
Peterson Land & Development Inc
Bought by
Sanchez Cesar L
Home Financials for this Owner
Home Financials are based on the most recent Mortgage that was taken out on this home.
Original Mortgage
$72,462
Interest Rate
7.87%
Mortgage Type
FHA
Purchase Details
Closed on
Jan 21, 1996
Sold by
Moore Gary L
Bought by
Peterson Land & Development Inc
Home Financials for this Owner
Home Financials are based on the most recent Mortgage that was taken out on this home.
Original Mortgage
$55,162
Interest Rate
7.14%
Mortgage Type
Construction
Create a Home Valuation Report for This Property
The Home Valuation Report is an in-depth analysis detailing your home's value as well as a comparison with similar homes in the area
Purchase History
| Date | Buyer | Sale Price | Title Company |
|---|---|---|---|
| Sanchez Cesar L | -- | Servicelink | |
| Sanchez Cesar L | $72,500 | Continental Lawyers Title Co | |
| Peterson Land & Development Inc | $9,500 | Continental Lawyers Title Co |
Source: Public Records
Mortgage History
| Date | Status | Borrower | Loan Amount |
|---|---|---|---|
| Open | Sanchez Cesar L | $120,000 | |
| Closed | Sanchez Cesar L | $72,462 | |
| Previous Owner | Peterson Land & Development Inc | $55,162 |
Source: Public Records
Tax History
| Year | Tax Paid | Tax Assessment Tax Assessment Total Assessment is a certain percentage of the fair market value that is determined by local assessors to be the total taxable value of land and additions on the property. | Land | Improvement |
|---|---|---|---|---|
| 2025 | $1,280 | $118,080 | $16,286 | $101,794 |
| 2024 | $1,251 | $115,765 | $15,967 | $99,798 |
| 2023 | $1,236 | $113,495 | $15,654 | $97,841 |
| 2022 | $1,207 | $111,270 | $15,347 | $95,923 |
| 2021 | $1,184 | $109,088 | $15,046 | $94,042 |
| 2020 | $1,170 | $107,970 | $14,892 | $93,078 |
| 2019 | $1,145 | $105,853 | $14,600 | $91,253 |
| 2018 | $1,123 | $103,778 | $14,314 | $89,464 |
| 2017 | $1,102 | $101,743 | $14,033 | $87,710 |
| 2016 | $1,078 | $99,748 | $13,758 | $85,990 |
| 2015 | $1,064 | $98,249 | $13,551 | $84,698 |
| 2014 | $1,049 | $96,325 | $13,286 | $83,039 |
Source: Public Records
Map
Nearby Homes
- 11389 Hesperia Rd
- 0 Darwin Ave Unit HD25264451
- 11514 1st Ave
- 0 Catalpa Unit HD25253555
- 11497 2nd Ave
- 16709 Deodar St
- 0 Donert St
- 17771 Manzanita St
- 11412 Calcite Ave
- 17820 Sycamore St
- 17311 Bear Valley Rd
- 11509 3rd Ave
- 17814 Mesa St
- 17940 Alder St
- 11556 3rd Ave
- 11598 Peach Ave
- 0 Alder St
- 0 Yuma St
- 10793 G Ave
- 11922 Calcite Ave
- 17207 Birch St
- 17233 Birch St
- 17193 Birch St
- 17214 Birch St
- 11440 Santa fe Ave W
- 17228 Birch St
- 17202 Birch St
- 17240 Birch St
- 17181 Birch St
- 415271 Santa fe Ave W
- 415271 26 Santa fe Ave W
- 17254 Birch St
- 17188 Birch St
- 17172 Catalpa St
- 17167 Birch St
- 17176 Birch St
- 17184 Catalpa St
- 17208 Catalpa St
- 17138 Catalpa St
Your Personal Tour Guide
Ask me questions while you tour the home.