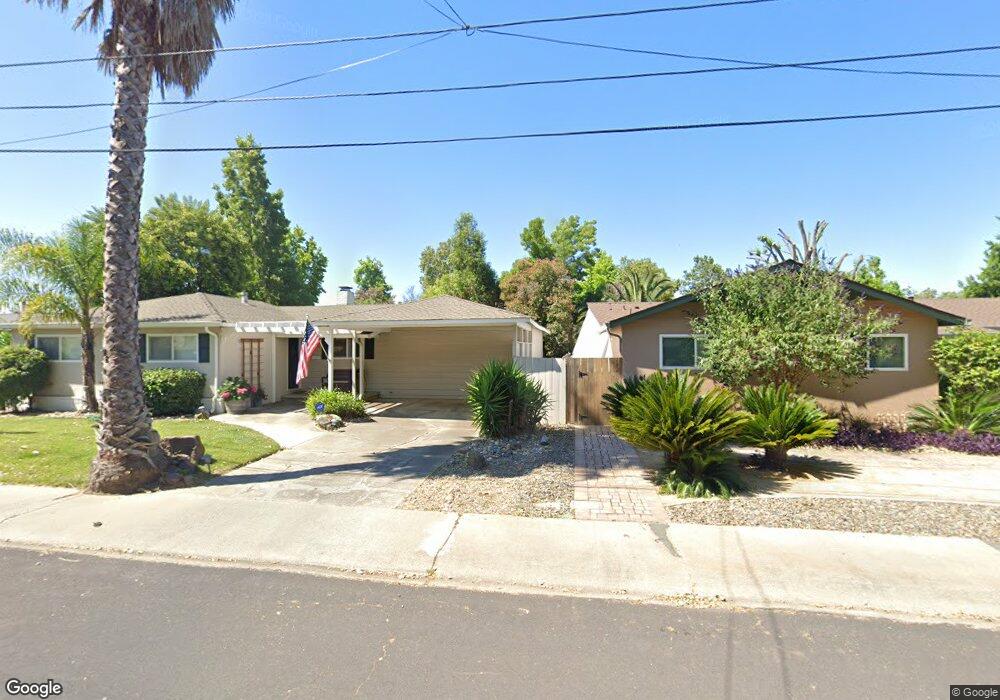
1722 Sapling Ct Unit D Concord, CA 94519
Dana Estates NeighborhoodEstimated Value: $389,344 - $486,000
2
Beds
1
Bath
914
Sq Ft
$473/Sq Ft
Est. Value
About This Home
This home is located at 1722 Sapling Ct Unit D, Concord, CA 94519 and is currently estimated at $432,336, approximately $473 per square foot. 1722 Sapling Ct Unit D is a home located in Contra Costa County with nearby schools including Westwood Elementary School, El Dorado Middle School, and Concord High School.
Ownership History
Date
Name
Owned For
Owner Type
Purchase Details
Closed on
Jul 26, 2017
Sold by
Clement Rentals Llc
Bought by
Guan Li
Current Estimated Value
Home Financials for this Owner
Home Financials are based on the most recent Mortgage that was taken out on this home.
Original Mortgage
$213,500
Outstanding Balance
$178,149
Interest Rate
3.96%
Mortgage Type
New Conventional
Estimated Equity
$254,187
Purchase Details
Closed on
Mar 3, 2015
Sold by
Laredo Walter F
Bought by
Clement Rentals Llc
Purchase Details
Closed on
Dec 29, 1999
Sold by
Fitzgerald Rita Louise Tre
Bought by
Laredo Walter F
Purchase Details
Closed on
Dec 30, 1994
Sold by
Fitzgerald Rita L and Fitzgerald John Joseph
Bought by
Fitzgerald Rita Louise
Create a Home Valuation Report for This Property
The Home Valuation Report is an in-depth analysis detailing your home's value as well as a comparison with similar homes in the area
Home Values in the Area
Average Home Value in this Area
Purchase History
| Date | Buyer | Sale Price | Title Company |
|---|---|---|---|
| Guan Li | $305,000 | North American Title Co Inc | |
| Clement Rentals Llc | $59,000 | First American Title | |
| Clement Rentals Llc | $59,000 | Accommodation | |
| Laredo Walter F | $102,000 | Old Republic Title Company | |
| Fitzgerald Rita Louise | -- | -- |
Source: Public Records
Mortgage History
| Date | Status | Borrower | Loan Amount |
|---|---|---|---|
| Open | Guan Li | $213,500 |
Source: Public Records
Tax History
| Year | Tax Paid | Tax Assessment Tax Assessment Total Assessment is a certain percentage of the fair market value that is determined by local assessors to be the total taxable value of land and additions on the property. | Land | Improvement |
|---|---|---|---|---|
| 2025 | $4,753 | $347,033 | $295,833 | $51,200 |
| 2024 | $4,518 | $340,230 | $290,033 | $50,197 |
| 2023 | $4,518 | $333,560 | $284,347 | $49,213 |
| 2022 | $4,441 | $327,021 | $278,772 | $48,249 |
| 2021 | $4,319 | $320,609 | $273,306 | $47,303 |
| 2019 | $4,226 | $311,100 | $265,200 | $45,900 |
| 2018 | $4,072 | $305,000 | $260,000 | $45,000 |
| 2017 | $3,544 | $258,886 | $181,221 | $77,665 |
| 2016 | $3,428 | $253,811 | $177,668 | $76,143 |
| 2015 | $1,955 | $130,428 | $51,146 | $79,282 |
| 2014 | $1,890 | $127,874 | $50,145 | $77,729 |
Source: Public Records
Map
Nearby Homes
- 1757 Eucalyptus Ct
- 1760 Sharon Dr
- 1745 Eucalyptus Ct
- 4074 Poplar Ave
- 3994 Newcastle Rd
- 1793 Live Oak Ave
- 4063 Salem St
- 1816 Lynwood Dr
- 1777 Clayton Way
- 4024 Salem St
- 4204 Dubhe Ct
- 1765 Glazier Dr
- 3530 Kevin Place
- 1579 West St
- 1832 Elkwood Dr
- 1662 Glazier Dr
- 1775 Leewood Way
- 3959 Chestnut Ave
- 3818 Village Rd
- 4273 Armand Dr
- 1722 Sapling Ct
- 1722 Sapling Ct Unit A
- 1722 Sapling Ct Unit C
- 1722 Sapling Ct Unit B
- 1724 Sapling Ct
- 1724 Sapling Ct Unit A
- 1724 Sapling Ct Unit B
- 1724 Sapling Ct Unit C
- 1724 Sapling Ct Unit D
- 1720 Sapling Ct Unit B
- 1720 Sapling Ct Unit A
- 1726 Sapling Ct
- 1726 Sapling Ct Unit A
- 1726 Sapling Ct Unit B
- 1816 Chinquapin Ct Unit A
- 1816 Chinquapin Ct Unit B
- 1816 Chinquapin Ct Unit C
- 1728 Sapling Ct Unit A
- 1728 Sapling Ct Unit B
- 1729 Lemonwood Dr
Your Personal Tour Guide
Ask me questions while you tour the home.