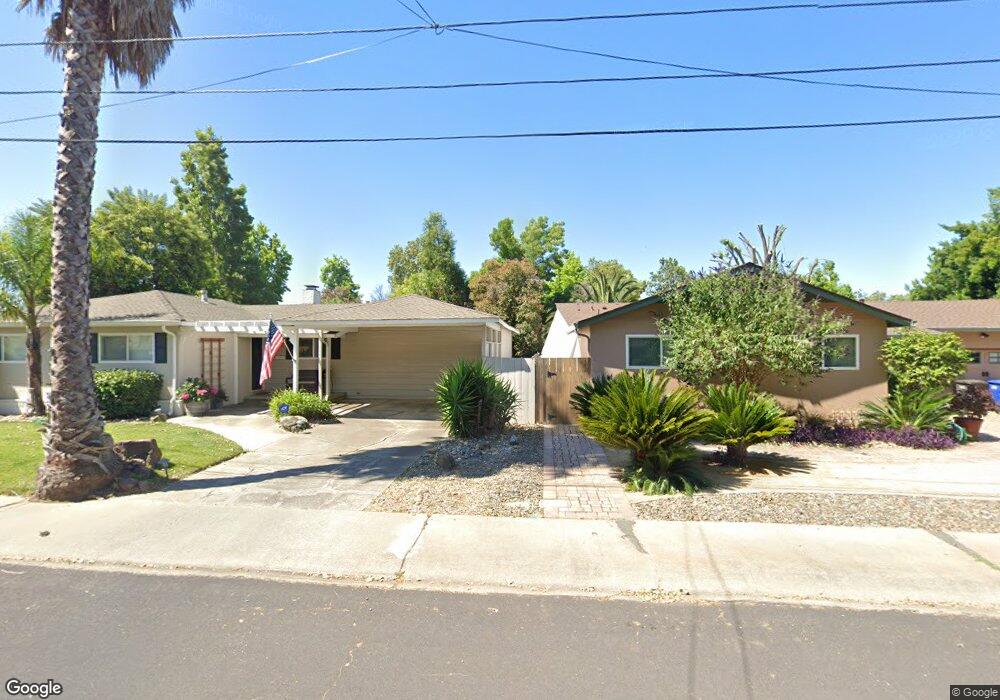
1726 Sapling Ct Unit A Concord, CA 94519
Dana Estates NeighborhoodEstimated Value: $443,555 - $493,000
3
Beds
2
Baths
1,173
Sq Ft
$402/Sq Ft
Est. Value
About This Home
This home is located at 1726 Sapling Ct Unit A, Concord, CA 94519 and is currently estimated at $471,389, approximately $401 per square foot. 1726 Sapling Ct Unit A is a home located in Contra Costa County with nearby schools including Westwood Elementary School, El Dorado Middle School, and Concord High School.
Ownership History
Date
Name
Owned For
Owner Type
Purchase Details
Closed on
Jan 13, 2016
Sold by
Johnson Sandra L
Bought by
Lee On Na
Current Estimated Value
Home Financials for this Owner
Home Financials are based on the most recent Mortgage that was taken out on this home.
Original Mortgage
$284,750
Outstanding Balance
$226,022
Interest Rate
3.9%
Mortgage Type
New Conventional
Estimated Equity
$245,367
Purchase Details
Closed on
Sep 11, 2013
Sold by
Tran Loc C and Vo Cam Thuyen T
Bought by
Johnson Sandra L
Home Financials for this Owner
Home Financials are based on the most recent Mortgage that was taken out on this home.
Original Mortgage
$194,000
Interest Rate
4.36%
Mortgage Type
New Conventional
Purchase Details
Closed on
Mar 20, 2012
Sold by
Tran Loc C and Vo Cam Thuyen T
Bought by
Tran Loc C and Vo Cam Thuyen T
Purchase Details
Closed on
Feb 27, 2009
Sold by
Deutsche Bank National Trust Company
Bought by
Tran Loc C and Vo Cam Thuyen T
Home Financials for this Owner
Home Financials are based on the most recent Mortgage that was taken out on this home.
Original Mortgage
$127,500
Interest Rate
5.17%
Mortgage Type
Purchase Money Mortgage
Purchase Details
Closed on
Jul 3, 2008
Sold by
Shinmoto David
Bought by
Deutsche Bank National Trust Co
Purchase Details
Closed on
Sep 10, 2003
Sold by
Newman Joan and Fralix Louise M
Bought by
Shinmoto David
Home Financials for this Owner
Home Financials are based on the most recent Mortgage that was taken out on this home.
Original Mortgage
$266,000
Interest Rate
6.37%
Mortgage Type
Purchase Money Mortgage
Purchase Details
Closed on
Jun 23, 2000
Sold by
Rainey Gregory M and Rainey Rebecca
Bought by
Newman Joan and Fralix Louise M
Home Financials for this Owner
Home Financials are based on the most recent Mortgage that was taken out on this home.
Original Mortgage
$129,675
Interest Rate
7.5%
Mortgage Type
Purchase Money Mortgage
Purchase Details
Closed on
Jul 18, 1995
Sold by
Thurston J Warren
Bought by
Rainey Gregory M and Rainey Rebecca L
Home Financials for this Owner
Home Financials are based on the most recent Mortgage that was taken out on this home.
Original Mortgage
$122,400
Interest Rate
7.59%
Mortgage Type
Assumption
Purchase Details
Closed on
Dec 12, 1994
Sold by
Thurston James W
Bought by
Thurston J Warren
Create a Home Valuation Report for This Property
The Home Valuation Report is an in-depth analysis detailing your home's value as well as a comparison with similar homes in the area
Home Values in the Area
Average Home Value in this Area
Purchase History
| Date | Buyer | Sale Price | Title Company |
|---|---|---|---|
| Lee On Na | $335,000 | Pacific Coast Title Company | |
| Johnson Sandra L | $259,000 | Old Republic Title Company | |
| Tran Loc C | -- | None Available | |
| Tran Loc C | $170,000 | First American Title Company | |
| Deutsche Bank National Trust Co | $200,850 | Accommodation | |
| Shinmoto David | $280,000 | First California Title | |
| Newman Joan | $136,500 | North American Title Co | |
| Rainey Gregory M | $122,500 | Fidelity National Title Ins | |
| Thurston J Warren | -- | -- |
Source: Public Records
Mortgage History
| Date | Status | Borrower | Loan Amount |
|---|---|---|---|
| Open | Lee On Na | $284,750 | |
| Previous Owner | Johnson Sandra L | $194,000 | |
| Previous Owner | Tran Loc C | $127,500 | |
| Previous Owner | Shinmoto David | $266,000 | |
| Previous Owner | Newman Joan | $129,675 | |
| Previous Owner | Rainey Gregory M | $122,400 |
Source: Public Records
Tax History
| Year | Tax Paid | Tax Assessment Tax Assessment Total Assessment is a certain percentage of the fair market value that is determined by local assessors to be the total taxable value of land and additions on the property. | Land | Improvement |
|---|---|---|---|---|
| 2025 | $5,376 | $396,564 | $284,107 | $112,457 |
| 2024 | $5,121 | $388,789 | $278,537 | $110,252 |
| 2023 | $5,121 | $381,167 | $273,076 | $108,091 |
| 2022 | $5,040 | $373,694 | $267,722 | $105,972 |
| 2021 | $4,908 | $366,368 | $262,473 | $103,895 |
| 2019 | $4,807 | $355,503 | $254,689 | $100,814 |
| 2018 | $4,619 | $348,534 | $249,696 | $98,838 |
| 2017 | $4,458 | $341,700 | $244,800 | $96,900 |
| 2016 | $3,506 | $268,202 | $103,553 | $164,649 |
| 2015 | $3,445 | $264,174 | $101,998 | $162,176 |
| 2014 | $3,365 | $259,000 | $100,000 | $159,000 |
Source: Public Records
Map
Nearby Homes
- 1757 Eucalyptus Ct
- 1760 Sharon Dr
- 1745 Eucalyptus Ct
- 4074 Poplar Ave
- 3994 Newcastle Rd
- 1793 Live Oak Ave
- 4063 Salem St
- 1816 Lynwood Dr
- 1777 Clayton Way
- 4024 Salem St
- 4204 Dubhe Ct
- 1765 Glazier Dr
- 3530 Kevin Place
- 1579 West St
- 1832 Elkwood Dr
- 1662 Glazier Dr
- 1775 Leewood Way
- 3959 Chestnut Ave
- 3818 Village Rd
- 4273 Armand Dr
- 1726 Sapling Ct
- 1726 Sapling Ct Unit B
- 1728 Sapling Ct Unit A
- 1728 Sapling Ct Unit B
- 1733 Lemonwood Dr
- 1720 Sapling Ct Unit B
- 1720 Sapling Ct Unit A
- 1731 Lemonwood Dr
- 1724 Sapling Ct
- 1724 Sapling Ct Unit A
- 1724 Sapling Ct Unit B
- 1724 Sapling Ct Unit C
- 1724 Sapling Ct Unit D
- 1735 Lemonwood Dr
- 1730 Sapling Ct Unit B
- 1722 Sapling Ct
- 1722 Sapling Ct Unit A
- 1722 Sapling Ct Unit C
- 1722 Sapling Ct Unit D
- 1722 Sapling Ct Unit B
Your Personal Tour Guide
Ask me questions while you tour the home.