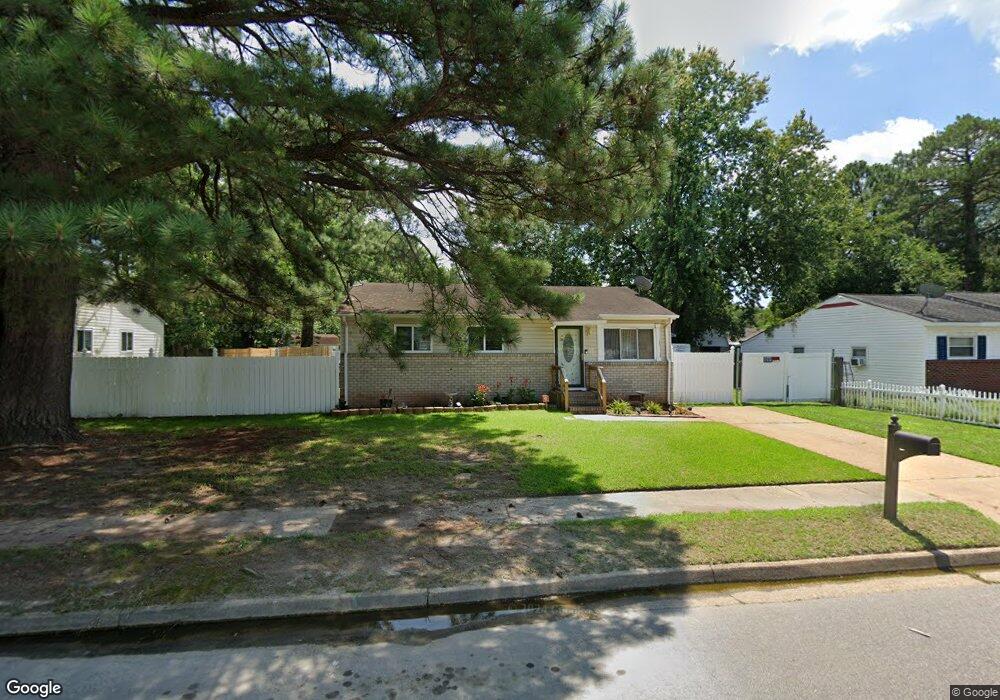
1733 Rowlock Rd Chesapeake, VA 23321
Western Branch NeighborhoodEstimated Value: $247,000 - $275,693
3
Beds
2
Baths
1,100
Sq Ft
$237/Sq Ft
Est. Value
About This Home
This home is located at 1733 Rowlock Rd, Chesapeake, VA 23321 and is currently estimated at $261,173, approximately $237 per square foot. 1733 Rowlock Rd is a home located in Chesapeake City with nearby schools including Southwestern Elementary School, Jolliff Middle School, and Western Branch High School.
Ownership History
Date
Name
Owned For
Owner Type
Purchase Details
Closed on
Oct 3, 2014
Sold by
Allen Joseph
Bought by
Roberts Allison C
Current Estimated Value
Home Financials for this Owner
Home Financials are based on the most recent Mortgage that was taken out on this home.
Original Mortgage
$147,096
Outstanding Balance
$112,770
Interest Rate
4.1%
Mortgage Type
VA
Estimated Equity
$148,403
Purchase Details
Closed on
May 27, 2014
Sold by
U S Bank Na
Bought by
Allen Joseph
Purchase Details
Closed on
Mar 11, 2014
Sold by
Commonwealth Trustees Llc and Tucker Jacquelin K
Bought by
U S Bank National Association
Purchase Details
Closed on
Apr 17, 2006
Sold by
Krayowski Anthony C
Bought by
Tucker Brian E
Home Financials for this Owner
Home Financials are based on the most recent Mortgage that was taken out on this home.
Original Mortgage
$111,920
Interest Rate
6.4%
Mortgage Type
New Conventional
Create a Home Valuation Report for This Property
The Home Valuation Report is an in-depth analysis detailing your home's value as well as a comparison with similar homes in the area
Home Values in the Area
Average Home Value in this Area
Purchase History
| Date | Buyer | Sale Price | Title Company |
|---|---|---|---|
| Roberts Allison C | $144,000 | -- | |
| Allen Joseph | $60,000 | -- | |
| U S Bank National Association | $68,680 | -- | |
| Tucker Brian E | $139,900 | -- |
Source: Public Records
Mortgage History
| Date | Status | Borrower | Loan Amount |
|---|---|---|---|
| Open | Roberts Allison C | $147,096 | |
| Previous Owner | Tucker Brian E | $111,920 |
Source: Public Records
Tax History
| Year | Tax Paid | Tax Assessment Tax Assessment Total Assessment is a certain percentage of the fair market value that is determined by local assessors to be the total taxable value of land and additions on the property. | Land | Improvement |
|---|---|---|---|---|
| 2025 | $2,360 | $244,200 | $120,000 | $124,200 |
| 2024 | $2,360 | $233,700 | $120,000 | $113,700 |
| 2023 | $1,901 | $215,500 | $110,000 | $105,500 |
| 2022 | $1,878 | $185,900 | $80,000 | $105,900 |
| 2021 | $1,674 | $159,400 | $65,000 | $94,400 |
| 2020 | $1,582 | $150,700 | $65,000 | $85,700 |
| 2019 | $1,519 | $144,700 | $55,000 | $89,700 |
| 2018 | $1,435 | $119,900 | $55,000 | $64,900 |
| 2017 | $1,416 | $134,900 | $55,000 | $79,900 |
| 2016 | $1,416 | $134,900 | $55,000 | $79,900 |
| 2015 | $1,416 | $134,900 | $55,000 | $79,900 |
| 2014 | $1,259 | $119,900 | $55,000 | $64,900 |
Source: Public Records
Map
Nearby Homes
- 3709 Bosun Dr
- 3917 Rex Cir
- 3943 Rex Cir
- 1821 Spar St
- 4126 River Breeze Cir
- 3861 Ahoy Dr
- 4004 River Breeze Cir
- 3924 Port Rd
- 3931 Port Rd
- 3912 Holly Cove Dr
- 800 Arnold Palmer Dr
- 4008 Sloop Trail
- 3860 Schooner Trail
- 3980 Port Rd
- 102 Ben Hogan Dr
- 4304 Center Mast Crest
- .2ac Airline Blvd
- 305 Bobby Jones Dr
- 3932 Pierce Ln
- 4301 Airline Blvd
Your Personal Tour Guide
Ask me questions while you tour the home.