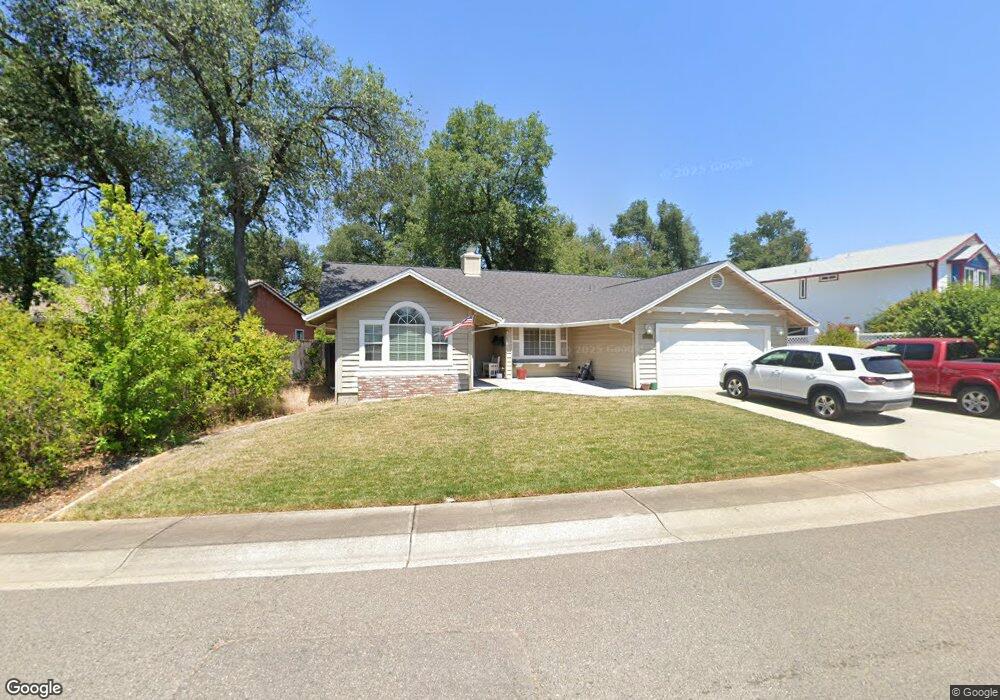
1738 Marlene Ave Redding, CA 96002
Oak Haven NeighborhoodEstimated Value: $381,956 - $423,000
3
Beds
2
Baths
1,744
Sq Ft
$231/Sq Ft
Est. Value
About This Home
This home is located at 1738 Marlene Ave, Redding, CA 96002 and is currently estimated at $402,739, approximately $230 per square foot. 1738 Marlene Ave is a home located in Shasta County with nearby schools including Alta Mesa Elementary School, Parsons Junior High School, and Enterprise High School.
Ownership History
Date
Name
Owned For
Owner Type
Purchase Details
Closed on
Dec 6, 2011
Sold by
Connors Thomas P and Connors Margaret B
Bought by
Lawson Robert E and Lawson Colleen M
Current Estimated Value
Home Financials for this Owner
Home Financials are based on the most recent Mortgage that was taken out on this home.
Original Mortgage
$167,200
Outstanding Balance
$113,991
Interest Rate
3.94%
Mortgage Type
New Conventional
Estimated Equity
$288,748
Purchase Details
Closed on
Oct 21, 2005
Sold by
Connors Thomas P and Connors Margaret B
Bought by
Connors Thomas P and Connors Margaret B
Purchase Details
Closed on
Aug 30, 2004
Sold by
Berry Howard W and Berry Shirley A
Bought by
Connors Thomas P and Connors Margaret B
Home Financials for this Owner
Home Financials are based on the most recent Mortgage that was taken out on this home.
Original Mortgage
$159,000
Interest Rate
5.94%
Mortgage Type
Unknown
Create a Home Valuation Report for This Property
The Home Valuation Report is an in-depth analysis detailing your home's value as well as a comparison with similar homes in the area
Home Values in the Area
Average Home Value in this Area
Purchase History
| Date | Buyer | Sale Price | Title Company |
|---|---|---|---|
| Lawson Robert E | $209,000 | Fidelity Natl Title Co Of Ca | |
| Connors Thomas P | -- | -- | |
| Connors Thomas P | $279,000 | Alliance Title Company |
Source: Public Records
Mortgage History
| Date | Status | Borrower | Loan Amount |
|---|---|---|---|
| Open | Lawson Robert E | $167,200 | |
| Previous Owner | Connors Thomas P | $159,000 |
Source: Public Records
Tax History
| Year | Tax Paid | Tax Assessment Tax Assessment Total Assessment is a certain percentage of the fair market value that is determined by local assessors to be the total taxable value of land and additions on the property. | Land | Improvement |
|---|---|---|---|---|
| 2025 | $2,900 | $273,657 | $50,235 | $223,422 |
| 2024 | $2,858 | $268,292 | $49,250 | $219,042 |
| 2023 | $2,858 | $263,033 | $48,285 | $214,748 |
| 2022 | $2,776 | $257,877 | $47,339 | $210,538 |
| 2021 | $2,680 | $252,821 | $46,411 | $206,410 |
| 2020 | $2,668 | $250,230 | $45,936 | $204,294 |
| 2019 | $2,645 | $245,325 | $45,036 | $200,289 |
| 2018 | $2,505 | $230,711 | $44,153 | $186,558 |
| 2017 | $2,547 | $226,188 | $43,288 | $182,900 |
| 2016 | $2,381 | $221,754 | $42,440 | $179,314 |
| 2015 | $2,361 | $218,424 | $41,803 | $176,621 |
| 2014 | $2,343 | $214,147 | $40,985 | $173,162 |
Source: Public Records
Map
Nearby Homes
- 3293 Middleton Ln
- 3283 Middleton Ln
- 3425 Silverwood St
- 3466 Silverwood St
- 3528 Silverwood St
- 3341 Timbercreek Dr
- 3360 Lawrence Rd
- 1397 Empress Ln
- 2976 West Way
- 2068 Solar Way
- 1513 Harpole Rd
- 3732 Mercury Dr
- 3178 Lawrence Rd
- 2906 Regal Ave
- 3759 Alma Ave
- 1354 Harpole Rd
- 3072 Alta Mesa Dr
- 1091 Del Sol Place
- 2855 Irwin Rd
- 2893 Alfreda Way
- 1724 Marlene Ave
- 1752 Marlene Ave
- 1726 Conifer Way
- 1766 Marlene Ave
- 1710 Marlene Ave
- 1718 Conifer Way
- 1745 Marlene Ave
- 1742 Conifer Way
- 1731 Marlene Ave
- 3300 Oak Haven Ct
- 1759 Marlene Ave
- 3357 Somerset Ave
- 1700 Marlene Ave
- 3314 Somerset Ave
- 3314 Oak Haven Ct
- 1748 Conifer Way
- 3328 Somerset Ave
- 1707 Conifer Way
- 1794 Marlene Ave
- 1735 Soda Springs Cir
Your Personal Tour Guide
Ask me questions while you tour the home.