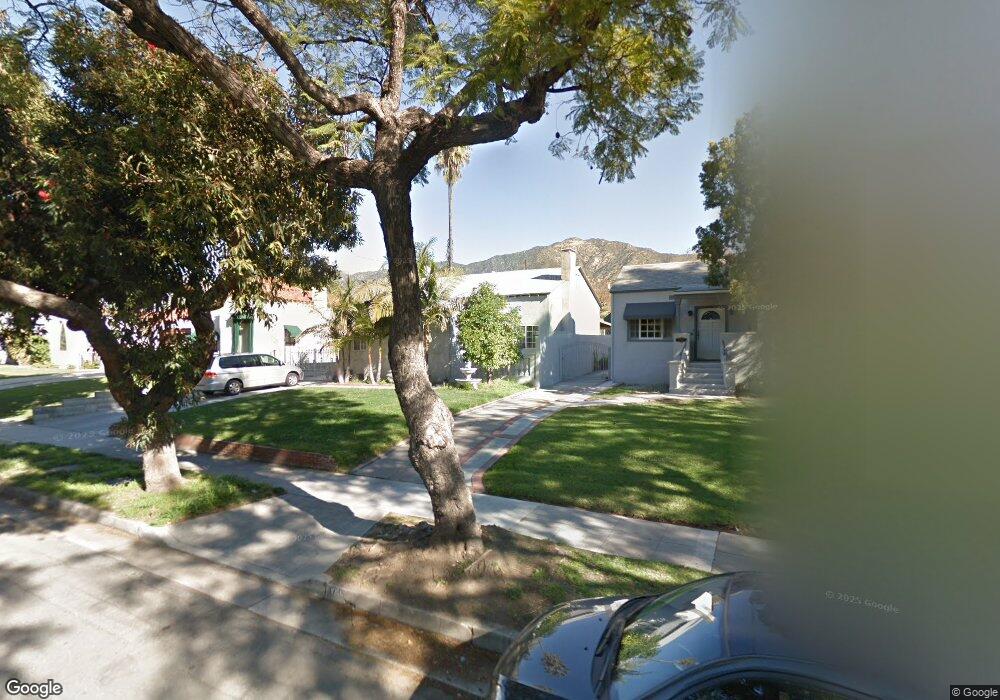
1739 W Kenneth Rd Glendale, CA 91201
El Miradero NeighborhoodEstimated Value: $1,208,793 - $1,508,000
3
Beds
1
Bath
1,288
Sq Ft
$1,043/Sq Ft
Est. Value
About This Home
This home is located at 1739 W Kenneth Rd, Glendale, CA 91201 and is currently estimated at $1,343,948, approximately $1,043 per square foot. 1739 W Kenneth Rd is a home located in Los Angeles County with nearby schools including Balboa Elementary School, Eleanor J. Toll Middle School, and Herbert Hoover High School.
Ownership History
Date
Name
Owned For
Owner Type
Purchase Details
Closed on
Dec 28, 2022
Sold by
Tolmoyan Victoria and Tolmoyan Vrtanes
Bought by
Victoria Tolmoyan Trust
Current Estimated Value
Purchase Details
Closed on
Jun 27, 2018
Sold by
Tolmoyan Victoria
Bought by
Tolmoyan Victoria and Victoria Tolmoyan Trust
Purchase Details
Closed on
Apr 16, 2018
Sold by
Tolmoyan V Rtanes and L & M Family Revocable Living
Bought by
Tolmoyan Victoria
Purchase Details
Closed on
Nov 12, 1998
Sold by
Tolmoyan Vrtanes
Bought by
Tolmoyan Vrtanes and Revocable Living Trust Of J &
Purchase Details
Closed on
Aug 21, 1995
Sold by
Min Pyong Yong and Min Chung Hee
Bought by
Tolmoyan Vrtanes
Home Financials for this Owner
Home Financials are based on the most recent Mortgage that was taken out on this home.
Original Mortgage
$110,000
Interest Rate
7.8%
Create a Home Valuation Report for This Property
The Home Valuation Report is an in-depth analysis detailing your home's value as well as a comparison with similar homes in the area
Home Values in the Area
Average Home Value in this Area
Purchase History
| Date | Buyer | Sale Price | Title Company |
|---|---|---|---|
| Victoria Tolmoyan Trust | -- | -- | |
| Tolmoyan Vrtanes | -- | -- | |
| Tolmoyan Victoria | -- | None Available | |
| Tolmoyan Victoria | -- | None Available | |
| Tolmoyan Vrtanes | -- | -- | |
| Tolmoyan Vrtanes | $187,000 | -- |
Source: Public Records
Mortgage History
| Date | Status | Borrower | Loan Amount |
|---|---|---|---|
| Previous Owner | Tolmoyan Vrtanes | $110,000 |
Source: Public Records
Tax History Compared to Growth
Tax History
| Year | Tax Paid | Tax Assessment Tax Assessment Total Assessment is a certain percentage of the fair market value that is determined by local assessors to be the total taxable value of land and additions on the property. | Land | Improvement |
|---|---|---|---|---|
| 2025 | $3,485 | $310,626 | $215,950 | $94,676 |
| 2024 | $3,485 | $304,536 | $211,716 | $92,820 |
| 2023 | $3,408 | $298,565 | $207,565 | $91,000 |
| 2022 | $3,346 | $292,712 | $203,496 | $89,216 |
| 2021 | $3,285 | $286,973 | $199,506 | $87,467 |
| 2019 | $3,161 | $278,464 | $193,590 | $84,874 |
| 2018 | $3,029 | $273,005 | $189,795 | $83,210 |
| 2016 | $2,878 | $262,406 | $182,426 | $79,980 |
| 2015 | $2,820 | $258,465 | $179,686 | $78,779 |
| 2014 | $2,802 | $253,403 | $176,167 | $77,236 |
Source: Public Records
Map
Nearby Homes
- 1245 Irving Ave
- 1362 Linden Ave
- 1437 Raymond Ave
- 1164 Irving Ave
- 1445 Raymond Ave
- 1450 Irving Ave
- 1157 Justin Ave
- 1230 Spazier Ave
- 1404 Sycamore Ave
- 1160 Elm Ave
- 1153 Ruberta Ave
- 1066 Thompson Ave Unit 5
- 2005 Chilton Dr
- 1043 Thompson Ave Unit 11
- 1617 Irving Ave
- 1340 Glenwood Rd Unit 28
- 1340 Glenwood Rd Unit 4
- 1052 Elm Ave
- 1013 Allen Ave Unit 6
- 1021 Linden Ave
- 1735 W Kenneth Rd
- 1745 W Kenneth Rd
- 1749 W Kenneth Rd
- 1315 Raymond Ave
- 1312 Thompson Ave Unit A
- 1312 Thompson Ave
- 1755 W Kenneth Rd
- 1317 Raymond Ave
- 1316 Thompson Ave
- 1740 W Kenneth Rd
- 1321 Raymond Ave
- 1736 W Kenneth Rd
- 1744 W Kenneth Rd
- 1730 W Kenneth Rd
- 1752 W Kenneth Rd
- 1723 W Kenneth Rd
- 1320 Thompson Ave
- 1756 W Kenneth Rd
- 1325 Raymond Ave
- 1273 Raymond Ave