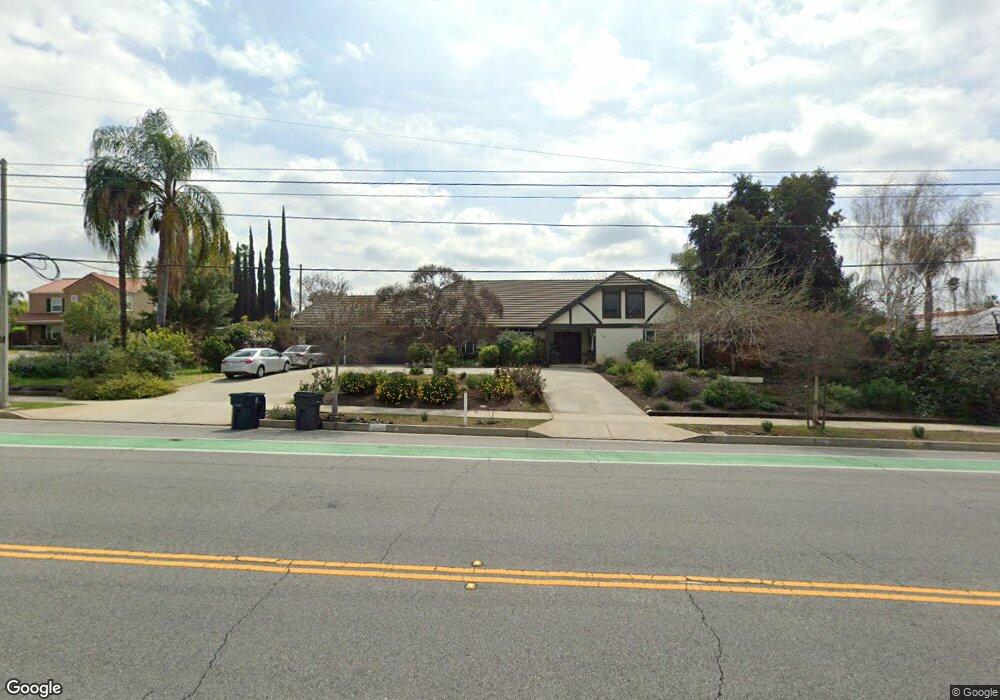
1740 E Citrus Ave Redlands, CA 92374
South Redlands NeighborhoodEstimated Value: $653,880 - $714,000
4
Beds
2
Baths
2,229
Sq Ft
$308/Sq Ft
Est. Value
About This Home
This home is located at 1740 E Citrus Ave, Redlands, CA 92374 and is currently estimated at $686,470, approximately $307 per square foot. 1740 E Citrus Ave is a home located in San Bernardino County with nearby schools including Crafton Elementary School, Moore Middle School, and Redlands East Valley High School.
Ownership History
Date
Name
Owned For
Owner Type
Purchase Details
Closed on
Feb 8, 2011
Sold by
Holman Lakay A
Bought by
Allred Gregory P and Allred Carol Ann
Current Estimated Value
Home Financials for this Owner
Home Financials are based on the most recent Mortgage that was taken out on this home.
Original Mortgage
$219,296
Outstanding Balance
$149,845
Interest Rate
4.75%
Mortgage Type
FHA
Estimated Equity
$536,625
Purchase Details
Closed on
Jun 2, 1997
Sold by
Holman William G and Holman Lakay A
Bought by
Holman William G and Holman Lakay A
Home Financials for this Owner
Home Financials are based on the most recent Mortgage that was taken out on this home.
Original Mortgage
$126,495
Interest Rate
7.98%
Mortgage Type
VA
Purchase Details
Closed on
Oct 7, 1994
Sold by
Holman William Gene and Holman Lakay A
Bought by
Holman William Gene and Holman Lakay A
Create a Home Valuation Report for This Property
The Home Valuation Report is an in-depth analysis detailing your home's value as well as a comparison with similar homes in the area
Home Values in the Area
Average Home Value in this Area
Purchase History
| Date | Buyer | Sale Price | Title Company |
|---|---|---|---|
| Allred Gregory P | $225,000 | Lawyers Title | |
| Holman William G | -- | Fidelity National Title Co | |
| Holman William Gene | -- | -- |
Source: Public Records
Mortgage History
| Date | Status | Borrower | Loan Amount |
|---|---|---|---|
| Open | Allred Gregory P | $219,296 | |
| Previous Owner | Holman William G | $126,495 |
Source: Public Records
Tax History
| Year | Tax Paid | Tax Assessment Tax Assessment Total Assessment is a certain percentage of the fair market value that is determined by local assessors to be the total taxable value of land and additions on the property. | Land | Improvement |
|---|---|---|---|---|
| 2025 | $3,517 | $288,264 | $86,479 | $201,785 |
| 2024 | $3,283 | $282,611 | $84,783 | $197,828 |
| 2023 | $3,278 | $277,070 | $83,121 | $193,949 |
| 2022 | $3,229 | $271,637 | $81,491 | $190,146 |
| 2021 | $3,286 | $266,311 | $79,893 | $186,418 |
| 2020 | $3,236 | $263,581 | $79,074 | $184,507 |
| 2019 | $3,145 | $258,413 | $77,524 | $180,889 |
| 2018 | $3,065 | $253,346 | $76,004 | $177,342 |
| 2017 | $3,038 | $248,379 | $74,514 | $173,865 |
| 2016 | $3,002 | $243,509 | $73,053 | $170,456 |
| 2015 | $2,978 | $239,852 | $71,956 | $167,896 |
| 2014 | $2,923 | $235,153 | $70,546 | $164,607 |
Source: Public Records
Map
Nearby Homes
- 1665 Wabash Ave
- 212 Eastpark Ln
- 1720 Kingston Cir
- 1592 Christopher Ln
- 1580 Lisa Ln
- 1562 E Citrus Ave
- 1575 Christopher Ln
- 56 Dearborn Cir
- 61 Sparrow Ct
- 626 N Dearborn St Unit 150
- 626 N Dearborn St Unit 55
- 626 N Dearborn St Unit 7
- 626 N Dearborn St
- 626 N Dearborn St Unit 61
- 0 E Colton Ave
- 1721 E Colton Ave Unit 33
- 1721 E Colton Ave Unit 115
- 1472 Moore St
- 1479 Moore St
- 1454 E Highland Ave
Your Personal Tour Guide
Ask me questions while you tour the home.