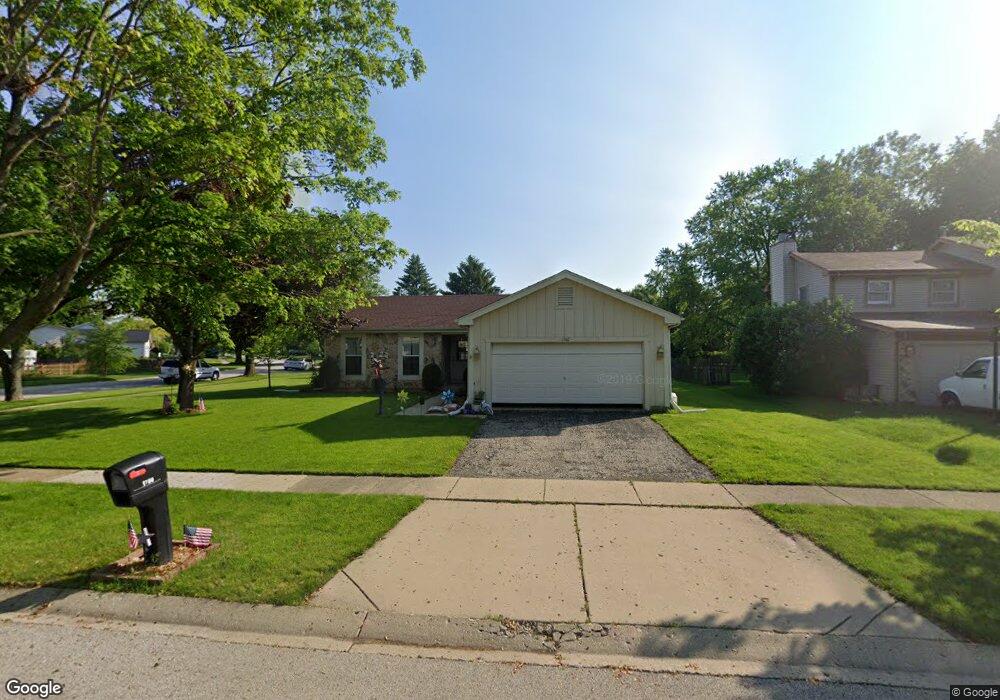
1740 Thorneapple Ln Algonquin, IL 60102
Estimated Value: $347,000 - $386,894
3
Beds
3
Baths
1,313
Sq Ft
$276/Sq Ft
Est. Value
About This Home
This home is located at 1740 Thorneapple Ln, Algonquin, IL 60102 and is currently estimated at $362,224, approximately $275 per square foot. 1740 Thorneapple Ln is a home located in McHenry County with nearby schools including Algonquin Lakes Elementary School, Algonquin Middle School, and Dundee-Crown High School.
Ownership History
Date
Name
Owned For
Owner Type
Purchase Details
Closed on
Mar 27, 2010
Sold by
Fannie Mae
Bought by
Kuster Stacey M
Current Estimated Value
Home Financials for this Owner
Home Financials are based on the most recent Mortgage that was taken out on this home.
Original Mortgage
$157,102
Interest Rate
5.16%
Mortgage Type
FHA
Purchase Details
Closed on
Dec 23, 2009
Sold by
Javed Khurran
Bought by
Federal National Mortgage Association
Purchase Details
Closed on
Nov 19, 2004
Sold by
Snick John W and Snick Eileen M
Bought by
Javed Khurram
Home Financials for this Owner
Home Financials are based on the most recent Mortgage that was taken out on this home.
Original Mortgage
$206,000
Interest Rate
7%
Mortgage Type
Unknown
Purchase Details
Closed on
Feb 20, 1998
Sold by
Snick John W and Snick Eileen M
Bought by
Snick John W and Snick Eileen M
Create a Home Valuation Report for This Property
The Home Valuation Report is an in-depth analysis detailing your home's value as well as a comparison with similar homes in the area
Home Values in the Area
Average Home Value in this Area
Purchase History
| Date | Buyer | Sale Price | Title Company |
|---|---|---|---|
| Kuster Stacey M | $160,000 | Fatic | |
| Federal National Mortgage Association | $160,000 | Fatic | |
| Javed Khurram | $229,000 | Pntn | |
| Snick John W | -- | -- |
Source: Public Records
Mortgage History
| Date | Status | Borrower | Loan Amount |
|---|---|---|---|
| Previous Owner | Kuster Stacey M | $157,102 | |
| Previous Owner | Javed Khurram | $206,000 |
Source: Public Records
Tax History Compared to Growth
Tax History
| Year | Tax Paid | Tax Assessment Tax Assessment Total Assessment is a certain percentage of the fair market value that is determined by local assessors to be the total taxable value of land and additions on the property. | Land | Improvement |
|---|---|---|---|---|
| 2024 | $8,416 | $115,579 | $21,460 | $94,119 |
| 2023 | $7,984 | $103,371 | $19,193 | $84,178 |
| 2022 | $6,143 | $77,628 | $20,766 | $56,862 |
| 2021 | $5,885 | $72,320 | $19,346 | $52,974 |
| 2020 | $5,725 | $69,760 | $18,661 | $51,099 |
| 2019 | $5,580 | $66,769 | $17,861 | $48,908 |
| 2018 | $5,712 | $65,927 | $16,486 | $49,441 |
| 2017 | $5,587 | $62,108 | $15,531 | $46,577 |
| 2016 | $5,495 | $58,252 | $14,567 | $43,685 |
| 2013 | -- | $54,563 | $13,589 | $40,974 |
Source: Public Records
Map
Nearby Homes
- 1561 Cumberland Pkwy
- 1782 Cumberland Pkwy
- 2 Cumberland Pkwy
- 1770 E Algonquin Rd
- Lot 4 b Ryan Pkwy
- 1659 E Algonquin Rd
- 1943 Ozark Pkwy
- 2008 Clematis Dr
- 605 Claymont Ct
- 920 Plymouth Ct
- 911 Old Oak Cir Unit 1
- 903 Old Oak Cir
- 1188 E Algonquin Rd
- 2150 E Algonquin Rd
- 620 Old Oak Cir
- 14 Oxford Ct
- 2 Sunset Ln
- 1670 Yosemite Pkwy
- 69 Alice St
- 9999 Sandbloom Rd
- 1750 Thorneapple Ln
- 1060 Thornewood Ln
- 1730 Thorneapple Ln
- 1760 Thorneapple Ln Unit 2
- 1050 Thornewood Ln
- 1739 Thorneapple Ln
- 1735 Thorneapple Ln
- 1745 Thorneapple Ln
- 1729 Thorneapple Ln
- 1720 Thorneapple Ln
- 1105 Applewood Ln
- 1749 Thorneapple Ln
- 1115 Applewood Ln
- 1065 Applewood Ln
- 1045 Thornewood Ln Unit 2
- 1725 Thorneapple Ln
- 1040 Thornewood Ln
- 1125 Applewood Ln
- 1055 Applewood Ln
- 1755 Thorneapple Ln