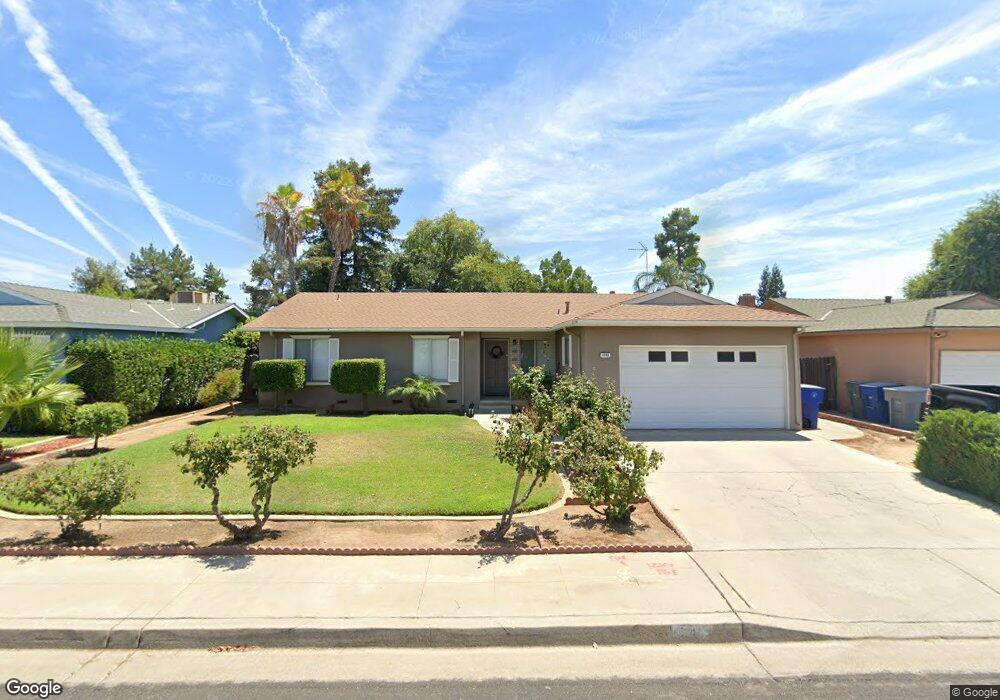
1742 Dennis Ave Clovis, CA 93611
Estimated Value: $365,929 - $466,000
3
Beds
2
Baths
1,453
Sq Ft
$281/Sq Ft
Est. Value
About This Home
This home is located at 1742 Dennis Ave, Clovis, CA 93611 and is currently estimated at $408,643, approximately $281 per square foot. 1742 Dennis Ave is a home located in Fresno County with nearby schools including Jefferson Elementary School, Clark Intermediate School, and Clovis High School.
Ownership History
Date
Name
Owned For
Owner Type
Purchase Details
Closed on
May 25, 2012
Sold by
Osborn David S and Osborn Karla E
Bought by
Osborn Jerald S and Osborn Denise R
Current Estimated Value
Purchase Details
Closed on
Jul 8, 2010
Sold by
Rivera Jimmy A
Bought by
Osborn David S and Osborn Karla E
Home Financials for this Owner
Home Financials are based on the most recent Mortgage that was taken out on this home.
Original Mortgage
$148,006
Interest Rate
4.75%
Mortgage Type
FHA
Purchase Details
Closed on
Jun 4, 2002
Sold by
Breding Lloyd Richard and Breding Caroline
Bought by
Rivera Jimmy A
Home Financials for this Owner
Home Financials are based on the most recent Mortgage that was taken out on this home.
Original Mortgage
$110,095
Interest Rate
6.86%
Purchase Details
Closed on
Mar 8, 2002
Sold by
Va
Bought by
Breding Lloyd Richard and Breding Caroline
Create a Home Valuation Report for This Property
The Home Valuation Report is an in-depth analysis detailing your home's value as well as a comparison with similar homes in the area
Home Values in the Area
Average Home Value in this Area
Purchase History
| Date | Buyer | Sale Price | Title Company |
|---|---|---|---|
| Osborn Jerald S | $145,000 | First American Title Company | |
| Osborn David S | $150,000 | First American Title Company | |
| Rivera Jimmy A | $113,500 | Chicago Title Co | |
| Breding Lloyd Richard | -- | -- |
Source: Public Records
Mortgage History
| Date | Status | Borrower | Loan Amount |
|---|---|---|---|
| Previous Owner | Osborn David S | $148,006 | |
| Previous Owner | Rivera Jimmy A | $110,095 | |
| Closed | Rivera Jimmy A | $3,405 |
Source: Public Records
Tax History
| Year | Tax Paid | Tax Assessment Tax Assessment Total Assessment is a certain percentage of the fair market value that is determined by local assessors to be the total taxable value of land and additions on the property. | Land | Improvement |
|---|---|---|---|---|
| 2025 | $2,157 | $181,736 | $50,235 | $131,501 |
| 2023 | $2,075 | $174,681 | $48,285 | $126,396 |
| 2022 | $2,048 | $171,257 | $47,339 | $123,918 |
| 2021 | $1,991 | $167,900 | $46,411 | $121,489 |
| 2020 | $1,983 | $166,180 | $45,936 | $120,244 |
| 2019 | $1,945 | $162,923 | $45,036 | $117,887 |
| 2018 | $1,903 | $159,729 | $44,153 | $115,576 |
| 2017 | $1,870 | $156,598 | $43,288 | $113,310 |
| 2016 | $1,807 | $153,529 | $42,440 | $111,089 |
| 2015 | $1,780 | $151,224 | $41,803 | $109,421 |
| 2014 | $1,747 | $148,263 | $40,985 | $107,278 |
Source: Public Records
Map
Nearby Homes
- 1721 Beverly Ave
- 1334 Shirley Ave
- 1273 Bundy Ave
- 1622 Dennis Ave
- 1521 Stanford Ave
- 1606 Barstow Ave
- 1830 Cougar Ln
- 1876 Cougar Ln
- 1584 Laverne Ave
- 1559 Poe Ln
- 1515 Keats Ave
- 1506 Robinwood Ave
- 2306 Stanford Ave
- 1228 Jefferson Ave
- 2034 Wrenwood Ave
- 1488 Alamos Ave
- 2061 Santa Ana Ave
- 2468 Laverne Ave
- 937 Filbert Ave
- 1946 Calimyrna Ave
- 1732 Dennis Ave
- 1752 Dennis Ave
- 1722 Dennis Ave
- 1762 Dennis Ave
- 1371 Renn Ave
- 1420 Shirley Ave
- 1505 Renn Ave
- 1712 Dennis Ave
- 1450 Shirley Ave
- 1711 Beverly Ave
- 1361 Renn Ave
- 1765 Dennis Ave
- 1515 Renn Ave
- 1715 Dennis Ave
- 1702 Dennis Ave
- 1701 Beverly Ave
- 1480 Shirley Ave
- 1352 Renn Ave
- 1351 Renn Ave
- 1516 Renn Ave
Your Personal Tour Guide
Ask me questions while you tour the home.