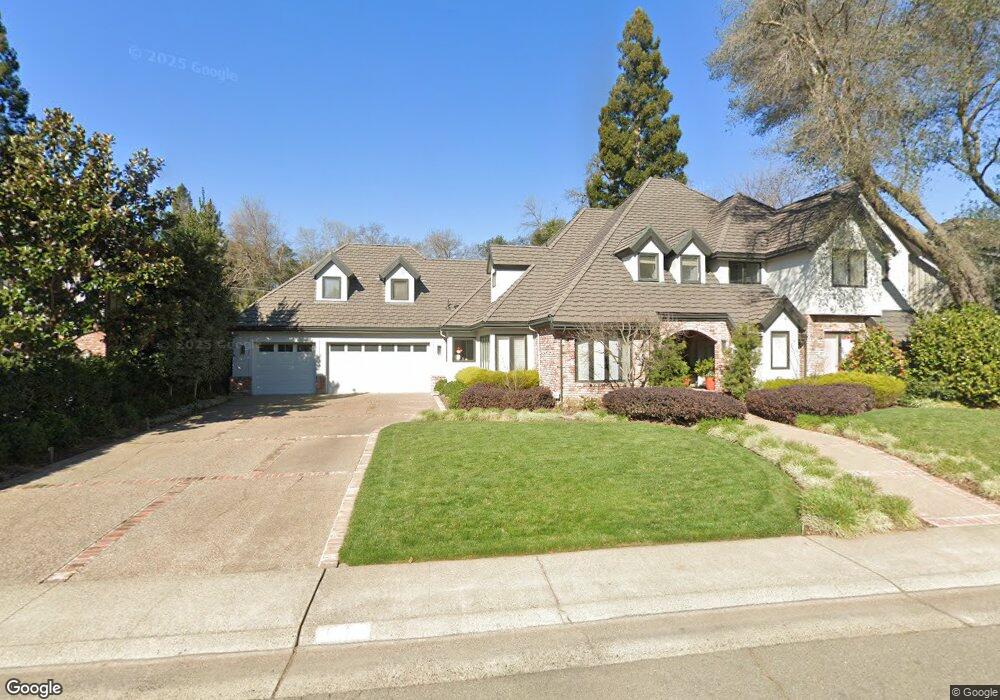
1745 Haggin Grove Way Carmichael, CA 95608
Carmichael Town Center NeighborhoodEstimated Value: $954,000 - $1,785,000
6
Beds
5
Baths
4,295
Sq Ft
$330/Sq Ft
Est. Value
About This Home
This home is located at 1745 Haggin Grove Way, Carmichael, CA 95608 and is currently estimated at $1,416,472, approximately $329 per square foot. 1745 Haggin Grove Way is a home located in Sacramento County with nearby schools including Del Dayo Elementary School, Arden Middle School, and Rio Americano High School.
Ownership History
Date
Name
Owned For
Owner Type
Purchase Details
Closed on
May 21, 2001
Sold by
Ostwald Mitchell S and Ostwald Teri G
Bought by
Ostwald Mitchell S and Ostwald Teri G
Current Estimated Value
Home Financials for this Owner
Home Financials are based on the most recent Mortgage that was taken out on this home.
Original Mortgage
$395,000
Outstanding Balance
$148,802
Interest Rate
7.15%
Estimated Equity
$1,267,670
Purchase Details
Closed on
Aug 31, 1998
Sold by
Ostwald Mitchell S and Ostwald Teri G
Bought by
Ostwald Mitchell S and Ostwald Teri G
Purchase Details
Closed on
Dec 5, 1997
Sold by
Palumbo Frank C and Palumbo Evelyn M
Bought by
Ostwald Mitchell S and Ostwald Teri G
Home Financials for this Owner
Home Financials are based on the most recent Mortgage that was taken out on this home.
Original Mortgage
$400,000
Interest Rate
7.19%
Create a Home Valuation Report for This Property
The Home Valuation Report is an in-depth analysis detailing your home's value as well as a comparison with similar homes in the area
Home Values in the Area
Average Home Value in this Area
Purchase History
| Date | Buyer | Sale Price | Title Company |
|---|---|---|---|
| Ostwald Mitchell S | -- | Placer Title Company | |
| Ostwald Mitchell S | -- | Placer Title Company | |
| Ostwald Mitchell S | -- | -- | |
| Ostwald Mitchell S | -- | -- | |
| Ostwald Mitchell S | $625,000 | Stewart Title |
Source: Public Records
Mortgage History
| Date | Status | Borrower | Loan Amount |
|---|---|---|---|
| Open | Ostwald Mitchell S | $395,000 | |
| Closed | Ostwald Mitchell S | $400,000 |
Source: Public Records
Tax History Compared to Growth
Tax History
| Year | Tax Paid | Tax Assessment Tax Assessment Total Assessment is a certain percentage of the fair market value that is determined by local assessors to be the total taxable value of land and additions on the property. | Land | Improvement |
|---|---|---|---|---|
| 2025 | $12,002 | $1,004,118 | $239,503 | $764,615 |
| 2024 | $12,002 | $984,430 | $234,807 | $749,623 |
| 2023 | $11,699 | $965,128 | $230,203 | $734,925 |
| 2022 | $11,635 | $946,205 | $225,690 | $720,515 |
| 2021 | $11,444 | $927,653 | $221,265 | $706,388 |
| 2020 | $11,232 | $918,142 | $218,997 | $699,145 |
| 2019 | $11,008 | $900,140 | $214,703 | $685,437 |
| 2018 | $10,801 | $882,492 | $210,494 | $671,998 |
| 2017 | $10,774 | $865,189 | $206,367 | $658,822 |
| 2016 | $10,061 | $848,225 | $202,321 | $645,904 |
| 2015 | $9,890 | $835,484 | $199,282 | $636,202 |
| 2014 | $9,685 | $819,119 | $195,379 | $623,740 |
Source: Public Records
Map
Nearby Homes
- 1749 Haggin Grove Way
- 1744 Haggin Grove Way
- 5312 Retreat Way
- 1626 Arden Bluffs Ln
- 1540 Gregory Way
- 1625 Gary Way
- 5424 Fair Oaks Blvd
- 2122 Gunn Rd
- 5021 Jardin Ln
- 5536 Clarendon Way
- 4935 Fair Oaks Blvd
- 1753 Park Place Dr
- 2141 Claremont Rd
- 1360 Pars Oak Ln
- 2239 Seabler Place
- 2312 Garfield Ave
- 4937 Donovan Dr
- 2104 Hamlet Place
- 1389 Pars Oak Ln
- 1325 Philomene Ct
- 1741 Haggin Grove Way
- 1753 Haggin Grove Way
- 1748 Haggin Grove Way
- 1737 Haggin Grove Way
- 5228 Marione Dr
- 5226 Marione Dr
- 1733 Haggin Grove Way
- 1752 Haggin Grove Way
- 1729 Haggin Grove Way
- 5232 Marione Dr
- 1757 Haggin Grove Way
- 5224 Marione Dr
- 1712 Haggin Grove Way
- 1708 Haggin Grove Way
- 5247 Arden Way
- 1756 Haggin Grove Way
- 1704 Haggin Grove Way
- 1721 Haggin Grove Way
- 5245 Arden Way
- 5220 Marione Dr