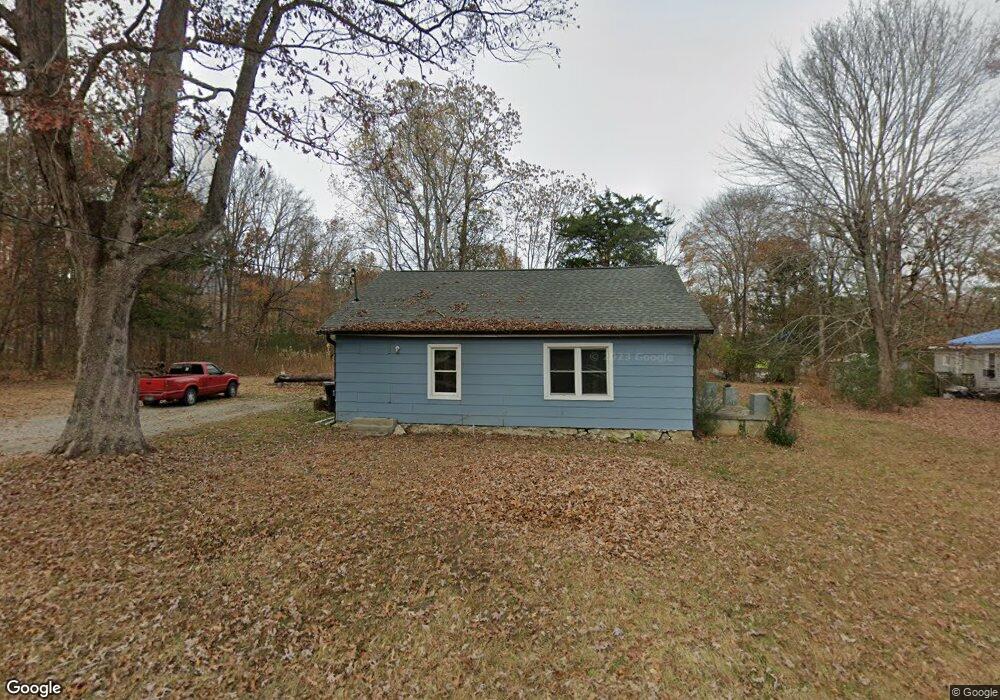
175 Savage Rd Dunlap, TN 37327
Estimated Value: $103,000 - $174,000
Studio
1
Bath
896
Sq Ft
$151/Sq Ft
Est. Value
About This Home
This home is located at 175 Savage Rd, Dunlap, TN 37327 and is currently estimated at $135,419, approximately $151 per square foot. 175 Savage Rd is a home located in Sequatchie County with nearby schools including Griffith Elementary School, Sequatchie County Middle School, and Sequatchie County High School.
Ownership History
Date
Name
Owned For
Owner Type
Purchase Details
Closed on
Sep 4, 2020
Sold by
Castaneda Robert A
Bought by
Torres Dania
Current Estimated Value
Home Financials for this Owner
Home Financials are based on the most recent Mortgage that was taken out on this home.
Original Mortgage
$21,000
Interest Rate
3%
Mortgage Type
New Conventional
Purchase Details
Closed on
Nov 15, 2016
Sold by
Altonen Timothy B
Bought by
Castaneda Robert A
Home Financials for this Owner
Home Financials are based on the most recent Mortgage that was taken out on this home.
Original Mortgage
$30,000
Interest Rate
3.52%
Mortgage Type
New Conventional
Purchase Details
Closed on
Jun 26, 2012
Sold by
Altonen Clifford T
Bought by
Altonen Timothy B and Altonen Debra E
Purchase Details
Closed on
May 26, 2004
Sold by
Lenard Oakes
Bought by
Altonen Clifford T
Create a Home Valuation Report for This Property
The Home Valuation Report is an in-depth analysis detailing your home's value as well as a comparison with similar homes in the area
Home Values in the Area
Average Home Value in this Area
Purchase History
| Date | Buyer | Sale Price | Title Company |
|---|---|---|---|
| Torres Dania | $20,530 | None Available | |
| Castaneda Robert A | $25,000 | -- | |
| Altonen Timothy B | -- | -- | |
| Altonen Clifford T | $30,000 | -- |
Source: Public Records
Mortgage History
| Date | Status | Borrower | Loan Amount |
|---|---|---|---|
| Closed | Torres Dania | $21,000 | |
| Previous Owner | Castaneda Robert A | $30,000 |
Source: Public Records
Tax History
| Year | Tax Paid | Tax Assessment Tax Assessment Total Assessment is a certain percentage of the fair market value that is determined by local assessors to be the total taxable value of land and additions on the property. | Land | Improvement |
|---|---|---|---|---|
| 2025 | -- | $17,375 | $4,450 | $12,925 |
| 2024 | $419 | $17,375 | $4,450 | $12,925 |
| 2023 | $419 | $17,375 | $4,450 | $12,925 |
| 2022 | $295 | $8,875 | $2,375 | $6,500 |
| 2021 | $290 | $8,875 | $2,375 | $6,500 |
| 2020 | $241 | $8,875 | $2,375 | $6,500 |
| 2019 | $241 | $7,350 | $2,375 | $4,975 |
| 2018 | $238 | $7,350 | $2,375 | $4,975 |
| 2017 | $272 | $8,525 | $2,375 | $6,150 |
| 2016 | $228 | $6,850 | $1,725 | $5,125 |
| 2015 | $228 | $6,850 | $1,725 | $5,125 |
| 2014 | $228 | $6,850 | $1,725 | $5,125 |
Source: Public Records
Map
Nearby Homes
- 116 Maple St
- 563 Old Union Rd
- 1038 Sawmill Creek Rd
- 481 Tram Trail
- 18298 Rankin Ave
- 79 Bear Oak Dr
- 249 Bear Oak Dr
- 157 Bear Oak Dr
- 217 A Day Dream Dr
- 267 Williams Rd
- 496 Boyd Rd
- 87 Happy Valley Rd
- 1473 Old York Hwy N
- 453 Hill Cir
- 0 Fredonia Loop
- 12 Fredonia Rd
- 2003 Fredonia Rd
- 11342 Fredonia Rd
- 07 Fredonia Rd
- 21 Fredonia Rd
- 176 Savage Rd
- 189 Savage Rd
- 189 Savage Rd Unit 1
- 189 Savage Rd Unit 2
- 198 Savage Rd
- 1020 Cherokee St
- 32 Cherokee St
- 6 Cherokee St
- 149 Savage Rd
- 0 Maple St Unit 1116433
- 0 Maple St Unit 1053016
- 47 Dana Dr
- 80 Dana Dr
- 47 Dana Dr
- 47 Dana Dr
- 427 Savage Rd
- 218 Savage Rd
- 98 Maple St
- 70 Maple St
- 130 Savage Rd
Your Personal Tour Guide
Ask me questions while you tour the home.