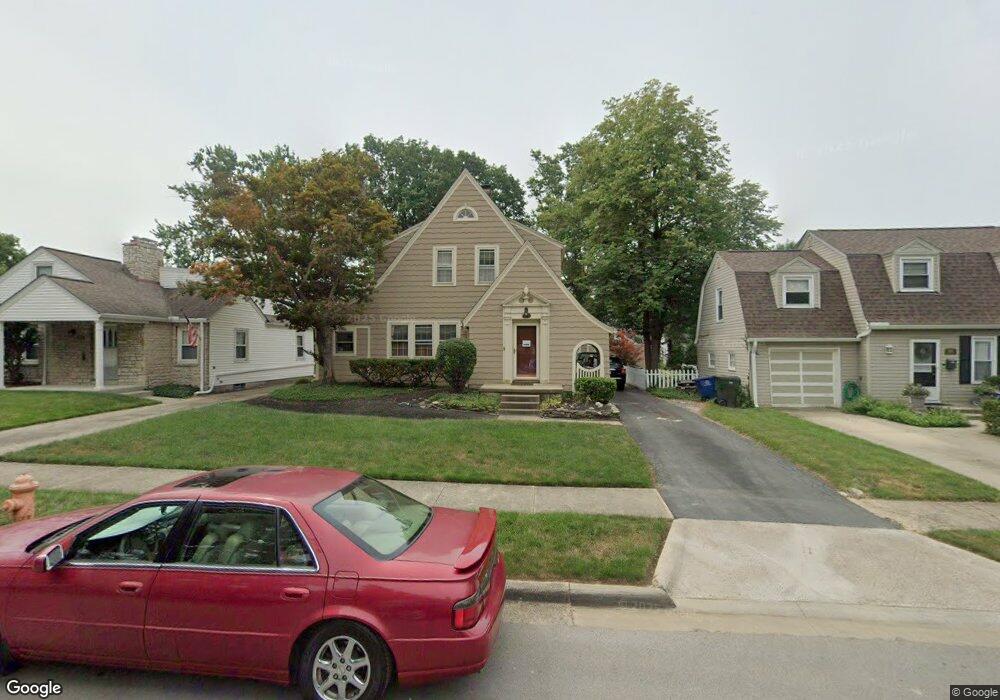
175 Wetmore Rd Columbus, OH 43214
Clintonville NeighborhoodEstimated Value: $440,000 - $483,000
3
Beds
1
Bath
1,700
Sq Ft
$271/Sq Ft
Est. Value
About This Home
This home is located at 175 Wetmore Rd, Columbus, OH 43214 and is currently estimated at $460,574, approximately $270 per square foot. 175 Wetmore Rd is a home located in Franklin County with nearby schools including Indian Springs Elementary School, Dominion Middle School, and Whetstone High School.
Ownership History
Date
Name
Owned For
Owner Type
Purchase Details
Closed on
Oct 5, 2004
Sold by
Gustafson Paris Theresa and Gustafson Paris Stephen
Bought by
Fuhrer Brian
Current Estimated Value
Home Financials for this Owner
Home Financials are based on the most recent Mortgage that was taken out on this home.
Original Mortgage
$224,000
Outstanding Balance
$108,985
Interest Rate
5.93%
Mortgage Type
Purchase Money Mortgage
Estimated Equity
$351,589
Purchase Details
Closed on
Jul 23, 2002
Sold by
Antonetz Mark W and Antonetz Julie D
Bought by
Ritchey Theresa A
Home Financials for this Owner
Home Financials are based on the most recent Mortgage that was taken out on this home.
Original Mortgage
$165,000
Interest Rate
6.62%
Mortgage Type
Purchase Money Mortgage
Purchase Details
Closed on
Jun 19, 1991
Bought by
Antonetz Mark W
Purchase Details
Closed on
Feb 1, 1986
Create a Home Valuation Report for This Property
The Home Valuation Report is an in-depth analysis detailing your home's value as well as a comparison with similar homes in the area
Home Values in the Area
Average Home Value in this Area
Purchase History
| Date | Buyer | Sale Price | Title Company |
|---|---|---|---|
| Fuhrer Brian | $224,000 | Chicago Tit | |
| Ritchey Theresa A | $204,000 | Chicago Title | |
| Antonetz Mark W | $97,900 | -- | |
| -- | $62,000 | -- |
Source: Public Records
Mortgage History
| Date | Status | Borrower | Loan Amount |
|---|---|---|---|
| Open | Fuhrer Brian | $224,000 | |
| Previous Owner | Ritchey Theresa A | $165,000 |
Source: Public Records
Tax History
| Year | Tax Paid | Tax Assessment Tax Assessment Total Assessment is a certain percentage of the fair market value that is determined by local assessors to be the total taxable value of land and additions on the property. | Land | Improvement |
|---|---|---|---|---|
| 2025 | $6,353 | $141,550 | $51,770 | $89,780 |
| 2024 | $6,353 | $141,550 | $51,770 | $89,780 |
| 2023 | $6,272 | $141,540 | $51,765 | $89,775 |
| 2022 | $5,388 | $103,890 | $36,930 | $66,960 |
| 2021 | $5,398 | $103,890 | $36,930 | $66,960 |
| 2020 | $5,405 | $103,890 | $36,930 | $66,960 |
| 2019 | $4,903 | $80,820 | $28,390 | $52,430 |
| 2018 | $4,785 | $80,820 | $28,390 | $52,430 |
| 2017 | $4,900 | $80,820 | $28,390 | $52,430 |
| 2016 | $5,152 | $77,770 | $18,340 | $59,430 |
| 2015 | $4,677 | $77,770 | $18,340 | $59,430 |
| 2014 | $4,688 | $77,770 | $18,340 | $59,430 |
| 2013 | $2,202 | $74,060 | $17,465 | $56,595 |
Source: Public Records
Map
Nearby Homes
- 144 Wetmore Rd
- 53 E Beechwold Blvd
- 103 E Jeffrey Place
- 350 E Beechwold Blvd
- 389 Wetmore Rd
- 4938 Fairway Ct Unit 4938-4944
- 243 E Schreyer Place
- 62 W Rathbone Ave
- 5019 N High St Unit 82
- 122 W Rathbone Ave
- 601 Morse Rd
- 4464 Zeller Rd
- 4299 Colerain Ave
- 702 E Weisheimer Rd
- 238 W Henderson Rd
- 4466 Olentangy Blvd
- 325 Starrett Ct
- 4374 Scenic Dr
- 5200 Fenway Ct Unit B
- 82 Blenheim Rd
- 169 Wetmore Rd
- 183 Wetmore Rd
- 163 Wetmore Rd
- 189 Wetmore Rd
- 197 Wetmore Rd
- 157 Wetmore Rd
- 178 E Beaumont Rd
- 170 E Beaumont Rd
- 182 E Beaumont Rd
- 149 Wetmore Rd
- 203 Wetmore Rd
- 190 E Beaumont Rd
- 162 E Beaumont Rd
- 178 Wetmore Rd
- 196 E Beaumont Rd
- 156 E Beaumont Rd
- 184 Wetmore Rd
- 170 Wetmore Rd
- 145 Wetmore Rd
- 211 Wetmore Rd
Your Personal Tour Guide
Ask me questions while you tour the home.