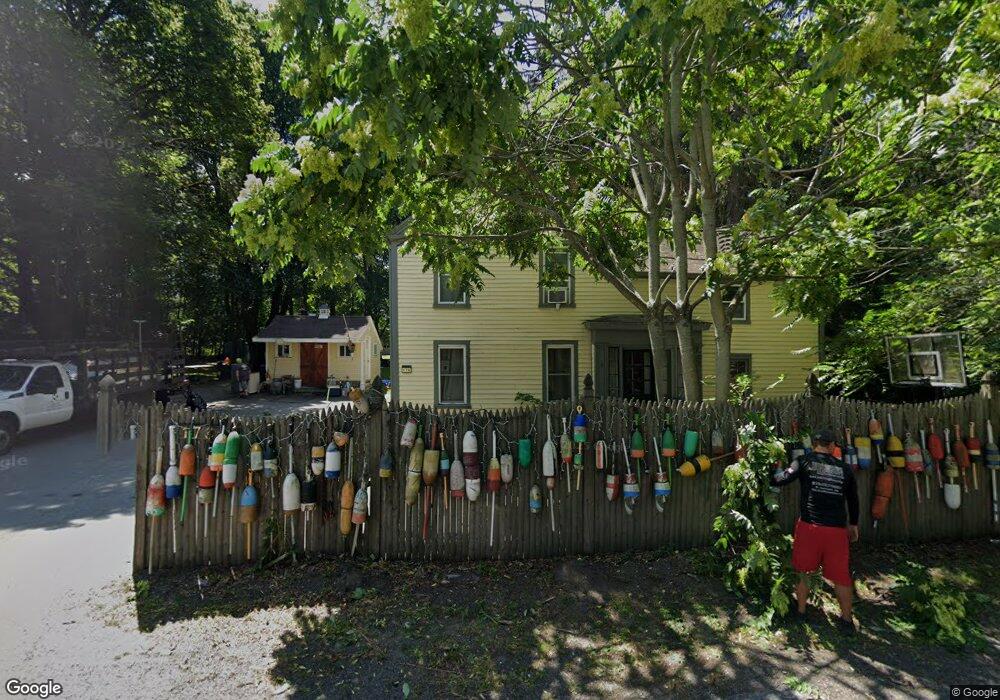
176 W Main St Georgetown, MA 01833
Estimated Value: $440,000 - $658,000
3
Beds
2
Baths
1,612
Sq Ft
$355/Sq Ft
Est. Value
About This Home
This home is located at 176 W Main St, Georgetown, MA 01833 and is currently estimated at $572,140, approximately $354 per square foot. 176 W Main St is a home located in Essex County with nearby schools including Perley Elementary School, Penn Brook School, and Georgetown High School.
Ownership History
Date
Name
Owned For
Owner Type
Purchase Details
Closed on
Aug 2, 2016
Sold by
Byron Edward J and Brewer-Byron Paula
Bought by
176 W Main St Rt
Current Estimated Value
Home Financials for this Owner
Home Financials are based on the most recent Mortgage that was taken out on this home.
Original Mortgage
$171,500
Outstanding Balance
$108,325
Interest Rate
3.54%
Mortgage Type
New Conventional
Estimated Equity
$463,815
Purchase Details
Closed on
Jan 17, 2003
Sold by
Camp Edward E
Bought by
Byron Edward J and Brewer-Byron Paula
Home Financials for this Owner
Home Financials are based on the most recent Mortgage that was taken out on this home.
Original Mortgage
$239,200
Interest Rate
6.18%
Mortgage Type
Purchase Money Mortgage
Purchase Details
Closed on
Jun 30, 2000
Sold by
Bourque Richard P and Bourque Cheryl A
Bought by
Camp Edward E
Purchase Details
Closed on
Sep 9, 1994
Sold by
Edwards Scott E and Edwards Rachel
Bought by
Bourque Richard P and Bourque Cheryl
Create a Home Valuation Report for This Property
The Home Valuation Report is an in-depth analysis detailing your home's value as well as a comparison with similar homes in the area
Home Values in the Area
Average Home Value in this Area
Purchase History
| Date | Buyer | Sale Price | Title Company |
|---|---|---|---|
| 176 W Main St Rt | $255,000 | -- | |
| Byron Edward J | $228,000 | -- | |
| Camp Edward E | $232,500 | -- | |
| Bourque Richard P | $160,000 | -- |
Source: Public Records
Mortgage History
| Date | Status | Borrower | Loan Amount |
|---|---|---|---|
| Open | 176 W Main St Rt | $171,500 | |
| Previous Owner | Bourque Richard P | $86,000 | |
| Previous Owner | Bourque Richard P | $239,200 | |
| Previous Owner | Bourque Richard P | $59,800 |
Source: Public Records
Tax History Compared to Growth
Tax History
| Year | Tax Paid | Tax Assessment Tax Assessment Total Assessment is a certain percentage of the fair market value that is determined by local assessors to be the total taxable value of land and additions on the property. | Land | Improvement |
|---|---|---|---|---|
| 2025 | $4,768 | $431,100 | $239,900 | $191,200 |
| 2024 | $4,015 | $319,900 | $165,400 | $154,500 |
| 2023 | $4,089 | $315,000 | $165,400 | $149,600 |
| 2022 | $3,983 | $282,900 | $143,800 | $139,100 |
| 2021 | $4,087 | $257,200 | $143,800 | $113,400 |
| 2020 | $4,095 | $257,200 | $143,800 | $113,400 |
| 2019 | $4,016 | $254,500 | $141,100 | $113,400 |
| 2018 | $4,041 | $254,500 | $141,100 | $113,400 |
| 2017 | $4,036 | $249,000 | $141,100 | $107,900 |
| 2016 | $3,952 | $249,000 | $141,100 | $107,900 |
| 2015 | $3,903 | $243,500 | $141,100 | $102,400 |
| 2014 | $3,421 | $243,500 | $141,100 | $102,400 |
Source: Public Records
Map
Nearby Homes
- 206 W Main St Unit 3
- 206 W Main St Unit 5
- 206 W Main St Unit 6
- 206 W Main St Unit 4
- 231 W Main St
- 51 W Main St Unit 6
- 79 Andover St
- 123 Pond St
- 11 Canterbury Dr
- 34 E Main St Unit 2
- 52 E Main St
- 6 Winter St
- 18 Larch Rd
- 135 Central St
- 7 Yale St
- 503 Diane Cir
- 70 Uptack Rd
- 1 Atwood Ln
- Lot 9 Katie Ln
- Lot 8 Katie Ln
- 183 W Main St
- 1 Richardson Ln
- 174 W Main St
- 1 Rock Pond Ave
- 8 Rock Pond Ave
- 185 W Main St
- 4 Rock Pond Ave
- 172 W Main St
- Lot 1 Richardson Ln
- 192 W Main St
- 3 Richardson Ln
- 6 Rock Pond Ave
- 3 Richardson Ln
- 5 Rock Pond Ave
- 170 W Main St
- 7 Rock Pond Ave
- 198 W Main St
- 5 Richardson Ln
- 10 Rock Pond Ave
- 196 W Main St