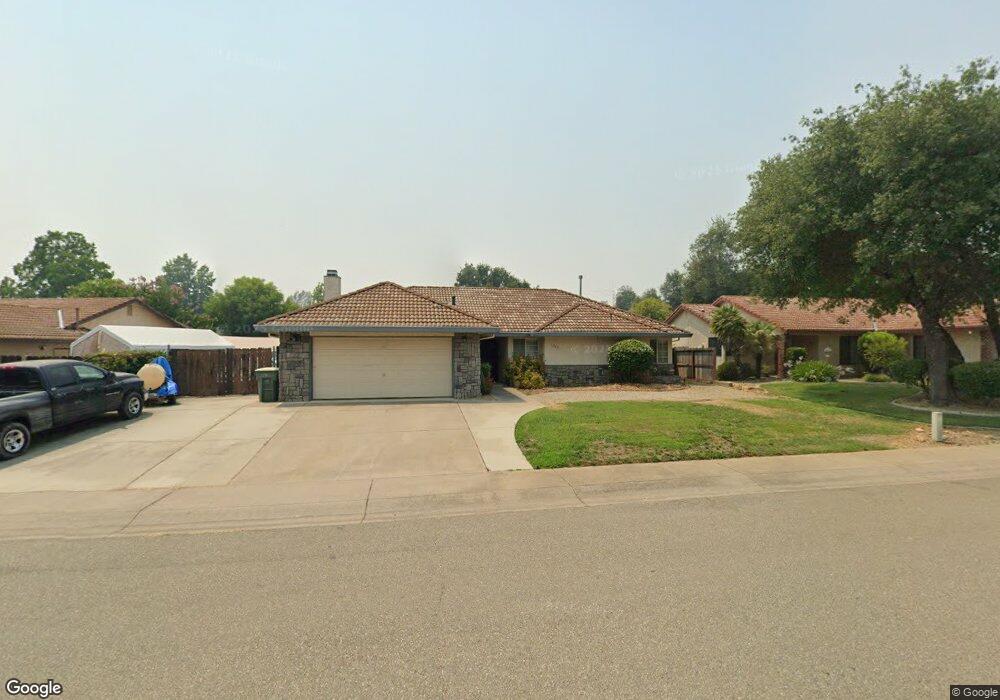
1762 Soda Springs Cil Unit ONE Redding, CA 96002
Oak Haven NeighborhoodEstimated Value: $327,372 - $358,000
3
Beds
2
Baths
1,405
Sq Ft
$244/Sq Ft
Est. Value
About This Home
This home is located at 1762 Soda Springs Cil Unit ONE, Redding, CA 96002 and is currently estimated at $342,843, approximately $244 per square foot. 1762 Soda Springs Cil Unit ONE is a home located in Shasta County with nearby schools including Alta Mesa Elementary School, Parsons Junior High School, and Enterprise High School.
Ownership History
Date
Name
Owned For
Owner Type
Purchase Details
Closed on
Aug 25, 2021
Sold by
Tingey Ken James and Tingey Mary N
Bought by
Tingey Ken James and Tingey Mary N
Current Estimated Value
Home Financials for this Owner
Home Financials are based on the most recent Mortgage that was taken out on this home.
Original Mortgage
$225,050
Outstanding Balance
$189,510
Interest Rate
2.8%
Mortgage Type
New Conventional
Estimated Equity
$153,333
Purchase Details
Closed on
Aug 1, 2001
Sold by
Mcwhorter Douglas H and Mcwhorter Elizabeth E
Bought by
Tingey James and Tingey Mary N
Home Financials for this Owner
Home Financials are based on the most recent Mortgage that was taken out on this home.
Original Mortgage
$108,000
Interest Rate
8.69%
Mortgage Type
Purchase Money Mortgage
Create a Home Valuation Report for This Property
The Home Valuation Report is an in-depth analysis detailing your home's value as well as a comparison with similar homes in the area
Home Values in the Area
Average Home Value in this Area
Purchase History
| Date | Buyer | Sale Price | Title Company |
|---|---|---|---|
| Tingey Ken James | -- | Fidelity Natl Ttl Co Of Ca | |
| Tingey James | $103,000 | Fidelity National Title Co |
Source: Public Records
Mortgage History
| Date | Status | Borrower | Loan Amount |
|---|---|---|---|
| Open | Tingey Ken James | $225,050 | |
| Closed | Tingey James | $108,000 |
Source: Public Records
Tax History Compared to Growth
Tax History
| Year | Tax Paid | Tax Assessment Tax Assessment Total Assessment is a certain percentage of the fair market value that is determined by local assessors to be the total taxable value of land and additions on the property. | Land | Improvement |
|---|---|---|---|---|
| 2025 | $1,673 | $152,136 | $51,691 | $100,445 |
| 2024 | $1,649 | $149,154 | $50,678 | $98,476 |
| 2023 | $1,649 | $146,231 | $49,685 | $96,546 |
| 2022 | $1,603 | $143,364 | $48,711 | $94,653 |
| 2021 | $1,548 | $140,554 | $47,756 | $92,798 |
| 2020 | $1,541 | $139,114 | $47,267 | $91,847 |
| 2019 | $1,529 | $136,388 | $46,341 | $90,047 |
| 2018 | $1,511 | $133,715 | $45,433 | $88,282 |
| 2017 | $1,564 | $133,470 | $44,543 | $88,927 |
| 2016 | $1,469 | $131,304 | $43,670 | $87,634 |
| 2015 | $1,465 | $130,085 | $43,015 | $87,070 |
| 2014 | $1,464 | $128,396 | $42,173 | $86,223 |
Source: Public Records
Map
Nearby Homes
- 3475 Oak Haven Ct
- 3628 Somerset Ave
- 3466 Silverwood St
- 3293 Middleton Ln
- 3896 Cambria Dr
- 3341 Timbercreek Dr
- 3283 Middleton Ln
- 3710 Indio Way
- 3897 Sunwood Dr
- 2068 Solar Way
- 3703 Harrow Ct
- 1201 Echo Rd
- 2145 Venus Way
- 1153 Ruthie Ln
- 3361 Alta Mesa Dr
- 3178 Lawrence Rd
- 3340 Hartnell Ave
- 1091 Del Sol Place
- 953 Camino Ct
- 952 Camino Ct
- 1762 Soda Springs Cir
- 1756 Soda Springs Cir
- 1770 Soda Springs Cir
- 1783 Somerset Ct
- 1744 Soda Springs Cir
- 1760 Somerset Ct
- 1776 Soda Springs Cir
- 1759 Soda Springs Cir
- 1771 Somerset Ct
- 1728 Soda Springs Cir
- 1753 Soda Springs Cir
- 1765 Soda Springs Cir
- 1753 Soda Springs Cr
- 1767 Soda Springs Cir
- 1751 Soda Springs Cir
- 1773 Soda Springs Cir
- 1748 Somerset Ct
- 1782 Soda Springs Cir
- 1716 Soda Springs Cir
- 1739 Soda Springs Cir