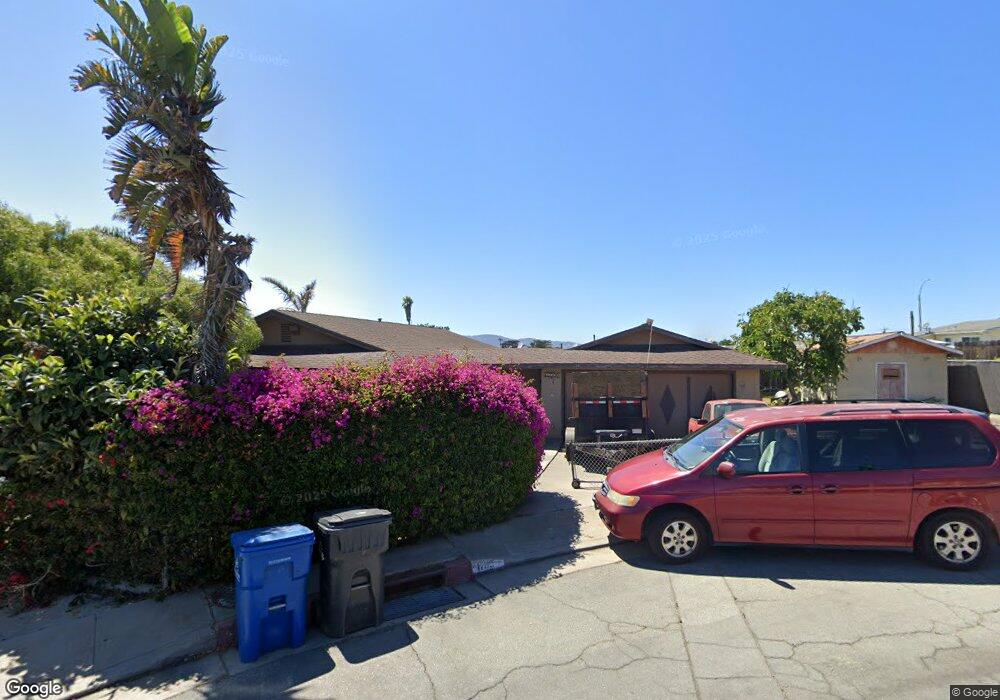
1765 Lowell St Unit 3 Seaside, CA 93955
Estimated Value: $781,000 - $904,000
4
Beds
3
Baths
1,328
Sq Ft
$634/Sq Ft
Est. Value
About This Home
This home is located at 1765 Lowell St Unit 3, Seaside, CA 93955 and is currently estimated at $842,539, approximately $634 per square foot. 1765 Lowell St Unit 3 is a home located in Monterey County with nearby schools including Martin Luther King, Seaside Middle School, and Seaside High School.
Ownership History
Date
Name
Owned For
Owner Type
Purchase Details
Closed on
Nov 29, 2010
Sold by
Sanchez Maria Francisca and Perez Maurilio
Bought by
Mejia Rafael and Ceja Armando
Current Estimated Value
Home Financials for this Owner
Home Financials are based on the most recent Mortgage that was taken out on this home.
Original Mortgage
$292,395
Outstanding Balance
$193,474
Interest Rate
4.25%
Mortgage Type
FHA
Estimated Equity
$649,065
Purchase Details
Closed on
Mar 12, 2001
Sold by
Greene John Donaldson and Greene Anita S L
Bought by
Perez Maurillo and Sanchez Maria Francisca
Home Financials for this Owner
Home Financials are based on the most recent Mortgage that was taken out on this home.
Original Mortgage
$268,000
Interest Rate
9.8%
Create a Home Valuation Report for This Property
The Home Valuation Report is an in-depth analysis detailing your home's value as well as a comparison with similar homes in the area
Home Values in the Area
Average Home Value in this Area
Purchase History
| Date | Buyer | Sale Price | Title Company |
|---|---|---|---|
| Mejia Rafael | $300,000 | Old Republic Title Company | |
| Perez Maurillo | $335,000 | Old Republic Title Company |
Source: Public Records
Mortgage History
| Date | Status | Borrower | Loan Amount |
|---|---|---|---|
| Open | Mejia Rafael | $292,395 | |
| Previous Owner | Perez Maurillo | $268,000 | |
| Closed | Perez Maurillo | $66,000 |
Source: Public Records
Tax History Compared to Growth
Tax History
| Year | Tax Paid | Tax Assessment Tax Assessment Total Assessment is a certain percentage of the fair market value that is determined by local assessors to be the total taxable value of land and additions on the property. | Land | Improvement |
|---|---|---|---|---|
| 2025 | $3,928 | $376,806 | $175,842 | $200,964 |
| 2024 | $3,928 | $369,419 | $172,395 | $197,024 |
| 2023 | $3,942 | $362,176 | $169,015 | $193,161 |
| 2022 | $3,886 | $355,075 | $165,701 | $189,374 |
| 2021 | $3,829 | $348,113 | $162,452 | $185,661 |
| 2020 | $3,685 | $344,545 | $160,787 | $183,758 |
| 2019 | $3,861 | $337,790 | $157,635 | $180,155 |
| 2018 | $3,709 | $331,168 | $154,545 | $176,623 |
| 2017 | $3,437 | $324,675 | $151,515 | $173,160 |
| 2016 | $3,375 | $318,310 | $148,545 | $169,765 |
| 2015 | $3,326 | $313,529 | $146,314 | $167,215 |
| 2014 | $3,268 | $307,388 | $143,448 | $163,940 |
Source: Public Records
Map
Nearby Homes
- 1740 Judson St
- 1714 Luxton St
- 1787 Laguna St
- 1717 Harding St
- 1713 Goodwin St
- 1676 Flores St
- 1146 Birch Ave Unit 37
- 1809 Soto St Unit 2
- 1699 Highland St
- 1615 Luzern St
- 1524 Luxton St
- 1610 Soto St
- 1195 Elm Ave
- 1524 Elm Ave
- 1501 Terrace St
- 1212 Trinity Ave Unit 10
- 1266 Wanda Ave
- 1605 Marietta St
- 1232 Vallejo St
- 977 Trinity Ave
- 1760 San Pablo Ave
- 1766 Kenneth St
- 1773 Lowell St
- 1768 Kenneth St
- 1760 L Place
- 1766 Lowell St
- 1753 Lowell St
- 1772 Kenneth St
- 1770 Lowell St
- 1777 Lowell St
- 1752 Kenneth St
- 1774 Kenneth St
- 1757 Luxton St
- 1769 Luxton St
- 1776 Lowell St
- 1765 Kenneth St
- 1761 Kenneth St
- 1750 Lowell St
- 1781 Lowell St
- 1771 Kenneth St