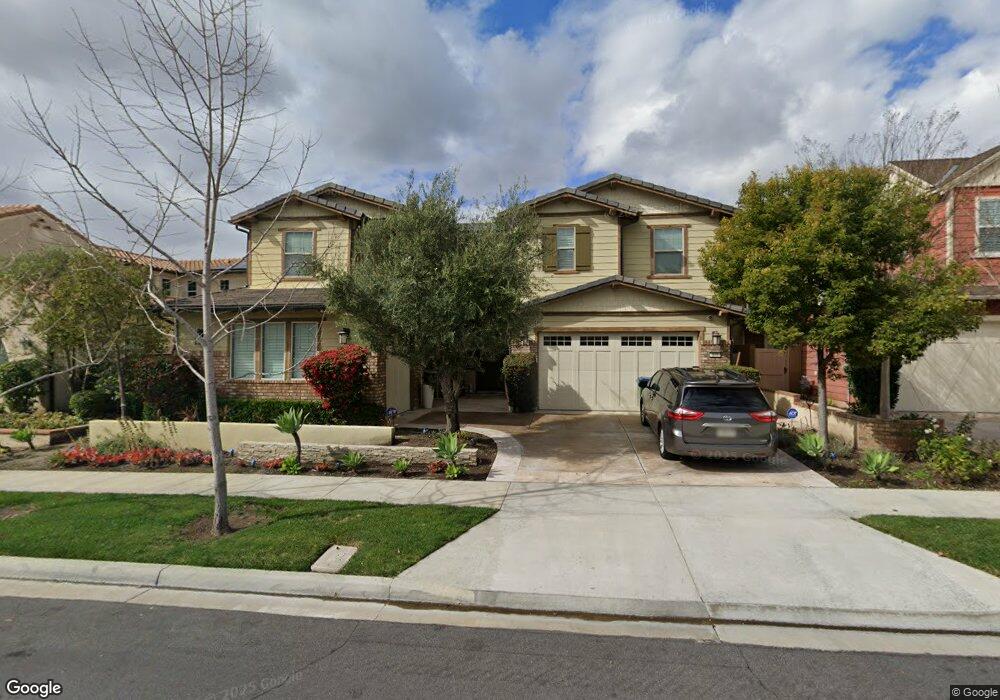
177 Pepperoot Irvine, CA 92618
Great Park NeighborhoodEstimated Value: $3,243,446 - $3,480,000
5
Beds
6
Baths
4,186
Sq Ft
$795/Sq Ft
Est. Value
About This Home
This home is located at 177 Pepperoot, Irvine, CA 92618 and is currently estimated at $3,327,862, approximately $794 per square foot. 177 Pepperoot is a home with nearby schools including Beacon Park, Portola High School, and Woodbury Elementary School.
Ownership History
Date
Name
Owned For
Owner Type
Purchase Details
Closed on
Jun 12, 2025
Sold by
Yeung David Kwok-Wai
Bought by
Yeung Wong Trust and Yeung
Current Estimated Value
Purchase Details
Closed on
May 13, 2015
Sold by
Yeung David K W and Wong Oliva Hazel
Bought by
Yeung Wong Trust
Purchase Details
Closed on
Sep 5, 2014
Sold by
Ryland Homes Of California Inc
Bought by
Yeung David and Wong Olivia
Create a Home Valuation Report for This Property
The Home Valuation Report is an in-depth analysis detailing your home's value as well as a comparison with similar homes in the area
Home Values in the Area
Average Home Value in this Area
Purchase History
| Date | Buyer | Sale Price | Title Company |
|---|---|---|---|
| Yeung Wong Trust | -- | None Listed On Document | |
| Yeung David Kwok-Wai | -- | None Listed On Document | |
| Yeung Wong Trust | -- | None Available | |
| Yeung David K W | -- | None Available | |
| Yeung Mao Dinh | -- | None Available | |
| Yeung David | $1,701,000 | First American Title Company |
Source: Public Records
Tax History
| Year | Tax Paid | Tax Assessment Tax Assessment Total Assessment is a certain percentage of the fair market value that is determined by local assessors to be the total taxable value of land and additions on the property. | Land | Improvement |
|---|---|---|---|---|
| 2025 | $31,730 | $2,043,790 | $1,053,676 | $990,114 |
| 2024 | $31,730 | $2,003,716 | $1,033,016 | $970,700 |
| 2023 | $31,038 | $1,964,428 | $1,012,761 | $951,667 |
| 2022 | $30,428 | $1,925,910 | $992,903 | $933,007 |
| 2021 | $29,830 | $1,888,148 | $973,435 | $914,713 |
| 2020 | $29,587 | $1,868,788 | $963,454 | $905,334 |
| 2019 | $29,108 | $1,832,146 | $944,563 | $887,583 |
| 2018 | $28,535 | $1,796,222 | $926,042 | $870,180 |
| 2017 | $27,974 | $1,761,002 | $907,884 | $853,118 |
| 2016 | $27,425 | $1,726,473 | $890,082 | $836,391 |
| 2015 | $24,020 | $1,414,921 | $674,282 | $740,639 |
| 2014 | -- | $661,074 | $661,074 | $0 |
Source: Public Records
Map
Nearby Homes
Your Personal Tour Guide
Ask me questions while you tour the home.