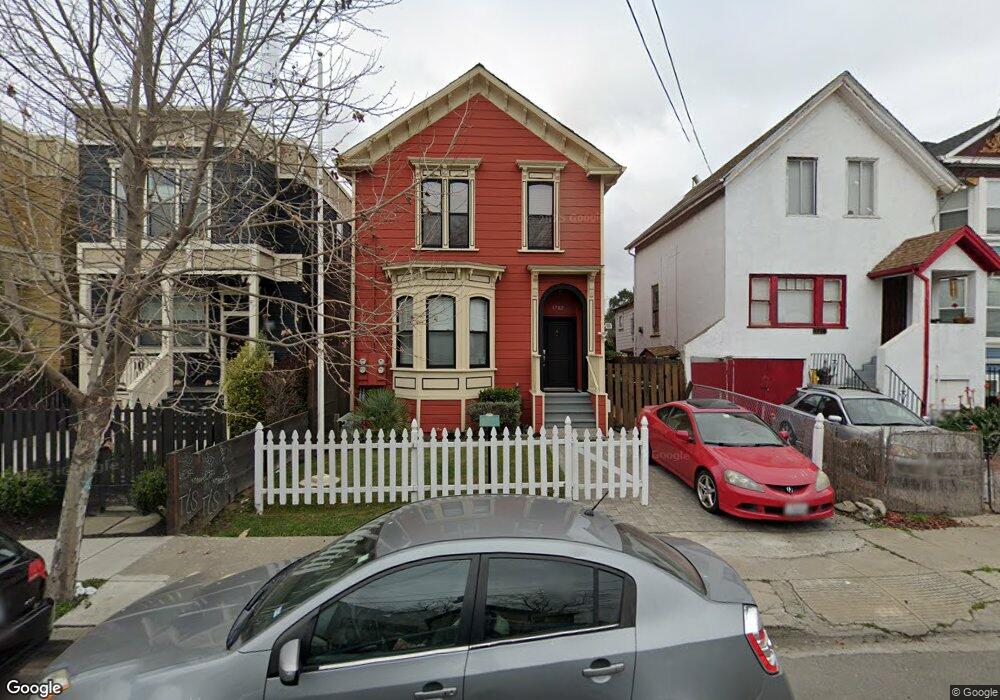
1782 8th St Unit 2 Oakland, CA 94607
West Oakland NeighborhoodEstimated Value: $613,000 - $771,436
1
Bed
1
Bath
840
Sq Ft
$824/Sq Ft
Est. Value
About This Home
This home is located at 1782 8th St Unit 2, Oakland, CA 94607 and is currently estimated at $692,218, approximately $824 per square foot. 1782 8th St Unit 2 is a home located in Alameda County with nearby schools including Prescott Elementary School, West Oakland Middle School, and McClymonds High School.
Ownership History
Date
Name
Owned For
Owner Type
Purchase Details
Closed on
Feb 27, 2008
Sold by
Sandalstone Group Llc
Bought by
Talati Prafull and Talati Daksha
Current Estimated Value
Home Financials for this Owner
Home Financials are based on the most recent Mortgage that was taken out on this home.
Original Mortgage
$280,000
Outstanding Balance
$169,035
Interest Rate
5.17%
Mortgage Type
Purchase Money Mortgage
Estimated Equity
$523,183
Create a Home Valuation Report for This Property
The Home Valuation Report is an in-depth analysis detailing your home's value as well as a comparison with similar homes in the area
Home Values in the Area
Average Home Value in this Area
Purchase History
| Date | Buyer | Sale Price | Title Company |
|---|---|---|---|
| Talati Prafull | $350,000 | Placer Title Company |
Source: Public Records
Mortgage History
| Date | Status | Borrower | Loan Amount |
|---|---|---|---|
| Open | Talati Prafull | $280,000 |
Source: Public Records
Tax History Compared to Growth
Tax History
| Year | Tax Paid | Tax Assessment Tax Assessment Total Assessment is a certain percentage of the fair market value that is determined by local assessors to be the total taxable value of land and additions on the property. | Land | Improvement |
|---|---|---|---|---|
| 2025 | $3,502 | $151,600 | $45,400 | $106,200 |
| 2024 | $3,502 | $132,000 | $39,600 | $92,400 |
| 2023 | $3,832 | $149,000 | $44,700 | $104,300 |
| 2022 | $4,439 | $202,000 | $60,600 | $141,400 |
| 2021 | $3,921 | $183,000 | $54,900 | $128,100 |
| 2020 | $4,218 | $206,000 | $61,800 | $144,200 |
| 2019 | $4,067 | $208,000 | $62,400 | $145,600 |
| 2018 | $3,960 | $202,000 | $60,600 | $141,400 |
| 2017 | $3,391 | $169,000 | $50,700 | $118,300 |
| 2016 | $2,994 | $150,000 | $45,000 | $105,000 |
| 2015 | $2,869 | $140,000 | $42,000 | $98,000 |
| 2014 | $2,803 | $137,000 | $41,100 | $95,900 |
Source: Public Records
Map
Nearby Homes
- 857 Mcelroy St
- 1771 Chase St
- 1745 Chase St
- 874 Pine St
- 873 Wood St
- 875 Wood St
- 1727 9th St
- 856 & 858 21st
- 945 Wood St
- 1018 Pine St
- 1201 Pine St Unit 130
- 1201 Pine St Unit 315
- 1201 Pine St Unit 153
- 1201 Pine St Unit 365
- 1201 Pine St Unit 363
- 1699 12th St
- 1307 Pullman Way
- 1234 Willow St
- 1211 Campbell St
- 1032 Peralta St