Estimated Value: $411,000 - $481,000
3
Beds
1
Bath
894
Sq Ft
$506/Sq Ft
Est. Value
About This Home
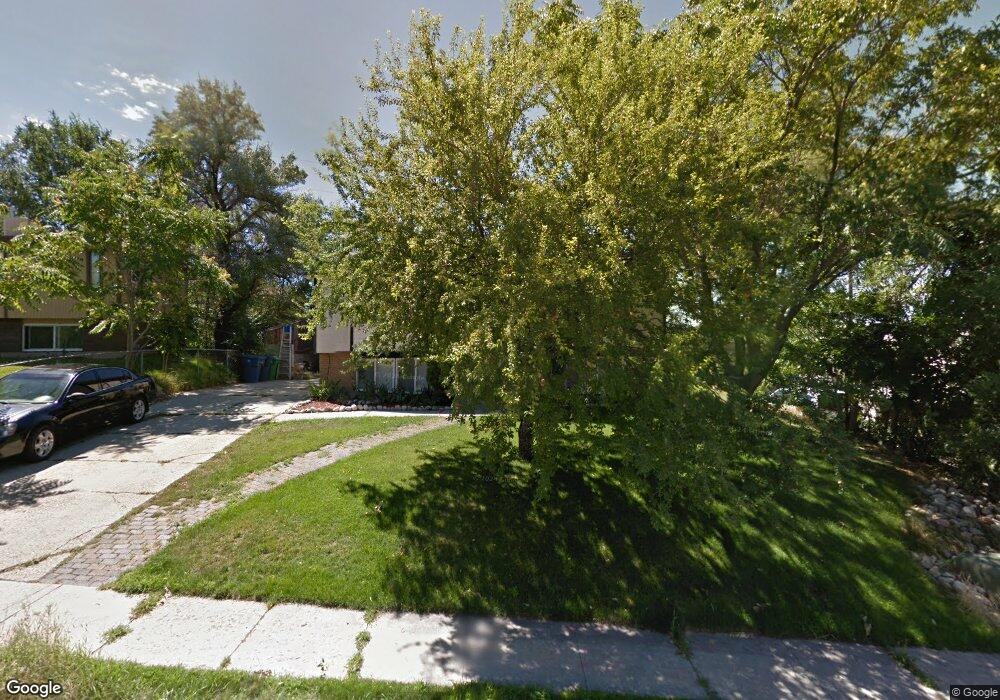
This home is located at 179 Durdham Ln, Sandy, UT 84070 and is currently estimated at $452,437, approximately $506 per square foot. 179 Durdham Ln is a home located in Salt Lake County with nearby schools including Mount Jordan Middle School, Jordan High, and Mountain Heights Academy.
Ownership History
Date
Name
Owned For
Owner Type
Purchase Details
Closed on
Jan 23, 2007
Sold by
Anderson Lance A
Bought by
Anderson Lance Arlyn and Anderson Angie Kae
Current Estimated Value
Home Financials for this Owner
Home Financials are based on the most recent Mortgage that was taken out on this home.
Original Mortgage
$131,500
Outstanding Balance
$78,102
Interest Rate
6.1%
Mortgage Type
New Conventional
Estimated Equity
$374,335
Purchase Details
Closed on
Jul 21, 2004
Sold by
Goble M Karen and M Karen Julander A
Bought by
Anderson Lance A
Home Financials for this Owner
Home Financials are based on the most recent Mortgage that was taken out on this home.
Original Mortgage
$113,400
Interest Rate
7%
Mortgage Type
Unknown
Purchase Details
Closed on
Apr 6, 1999
Sold by
Wallace Erlynn Rupp
Bought by
Distinguished Custom Homes Llc
Purchase Details
Closed on
Apr 24, 1986
Sold by
Goble Elwin B
Bought by
Goble M Karen
Create a Home Valuation Report for This Property
The Home Valuation Report is an in-depth analysis detailing your home's value as well as a comparison with similar homes in the area
Home Values in the Area
Average Home Value in this Area
Purchase History
| Date | Buyer | Sale Price | Title Company |
|---|---|---|---|
| Anderson Lance Arlyn | -- | None Available | |
| Anderson Lance A | -- | Title West | |
| Distinguished Custom Homes Llc | -- | Superior Title Company | |
| Goble M Karen | -- | Title West |
Source: Public Records
Mortgage History
| Date | Status | Borrower | Loan Amount |
|---|---|---|---|
| Open | Anderson Lance Arlyn | $131,500 | |
| Closed | Anderson Lance A | $113,400 |
Source: Public Records
Tax History
| Year | Tax Paid | Tax Assessment Tax Assessment Total Assessment is a certain percentage of the fair market value that is determined by local assessors to be the total taxable value of land and additions on the property. | Land | Improvement |
|---|---|---|---|---|
| 2025 | $1,671 | $388,800 | $92,600 | $296,200 |
| 2024 | $1,671 | $309,100 | $87,800 | $221,300 |
| 2023 | $1,671 | $309,400 | $83,400 | $226,000 |
| 2022 | $1,746 | $314,600 | $81,800 | $232,800 |
| 2021 | $1,564 | $239,800 | $69,500 | $170,300 |
| 2020 | $1,506 | $217,700 | $60,500 | $157,200 |
| 2019 | $1,318 | $185,700 | $60,500 | $125,200 |
| 2018 | $1,201 | $176,200 | $60,500 | $115,700 |
| 2017 | $1,226 | $171,800 | $55,600 | $116,200 |
| 2016 | $1,163 | $157,600 | $55,600 | $102,000 |
| 2015 | $1,078 | $135,200 | $52,300 | $82,900 |
| 2014 | $1,048 | $128,800 | $50,600 | $78,200 |
Source: Public Records
Map
Nearby Homes
- 9420 S Streatham Rd
- 8750 S 500 E
- 8812 S Cy's Park Ln Unit 6
- 8807 S Cy's Park Ln E Unit 1
- 8806 S Cy's Park Ln E Unit 4
- 8808 S Cy's Park Unit 5
- 165 Albion Village Way Unit 303
- 194 Albion Village Way Unit 303
- 170 Albion Village Way Unit 202
- 37 Crawford Place
- 9306 S 480 W Unit 8
- 186 Brent Cir
- 77 W Evening Star Way
- 628 W Creek Bluff Cove
- 181 E 9180 S
- 136 W Freedom Ave Unit 136
- 8475 S State St
- 9153 S Jefferson Place
- 9188 S Jefferson Place
- 8812 S Stratford Cir
- 173 Durdham Ln
- 173 W Durdham Ln
- 187 W Durdham Ln
- 187 Durdham Ln
- 195 Durdham Ln
- 161 Durdham Ln
- 182 Durdham Ln
- 182 W Durdham Ln
- 176 Durdham Ln
- 176 W Durdham Ln
- 188 Durdham Ln
- 201 Durdham Ln
- 9483 Streatham Rd
- 9470 Streatham Rd
- 9463 Turnpike Ln
- 9463 S Turnpike Ln
- 9475 S Streatham Rd
- 9475 Streatham Rd
- 209 Durdham Ln
- 179 W Oxford Rd
Your Personal Tour Guide
Ask me questions while you tour the home.