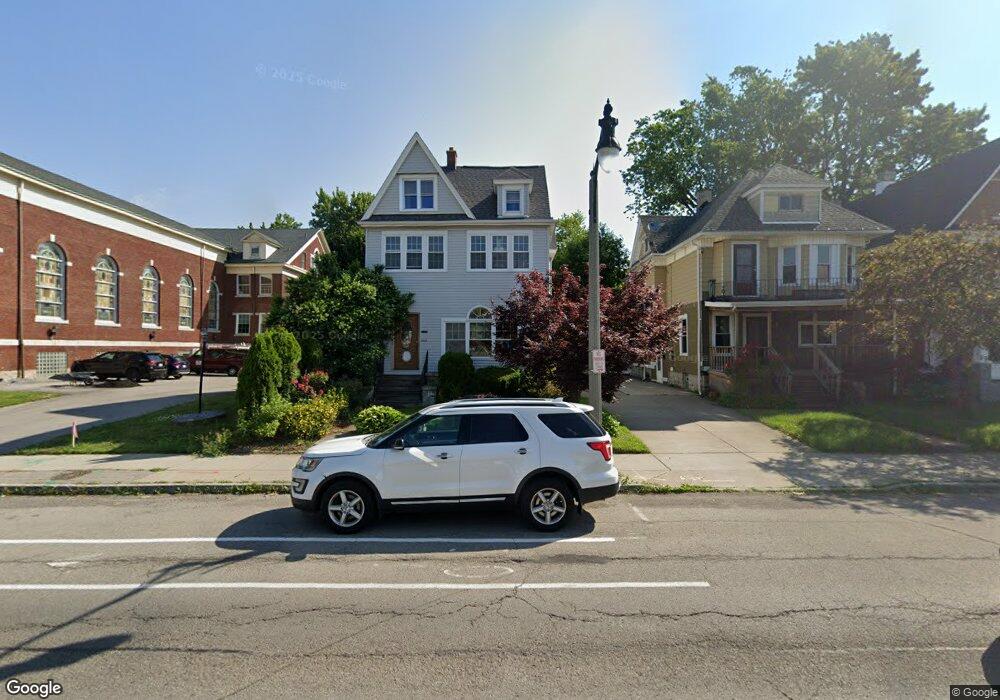
1790 Seneca St Buffalo, NY 14210
Seneca NeighborhoodEstimated Value: $161,876 - $225,000
6
Beds
2
Baths
2,369
Sq Ft
$85/Sq Ft
Est. Value
About This Home
This home is located at 1790 Seneca St, Buffalo, NY 14210 and is currently estimated at $200,469, approximately $84 per square foot. 1790 Seneca St is a home located in Erie County with nearby schools including South Buffalo Charter School.
Ownership History
Date
Name
Owned For
Owner Type
Purchase Details
Closed on
Mar 9, 2010
Sold by
Hammill Anthony P
Bought by
Otto John and Scarcello Peter
Current Estimated Value
Home Financials for this Owner
Home Financials are based on the most recent Mortgage that was taken out on this home.
Original Mortgage
$5,000
Interest Rate
5%
Mortgage Type
Seller Take Back
Purchase Details
Closed on
Aug 6, 2008
Sold by
Hammill Zachary J
Bought by
Hammill Anthony P
Create a Home Valuation Report for This Property
The Home Valuation Report is an in-depth analysis detailing your home's value as well as a comparison with similar homes in the area
Home Values in the Area
Average Home Value in this Area
Purchase History
| Date | Buyer | Sale Price | Title Company |
|---|---|---|---|
| Otto John | $20,000 | None Available | |
| Hammill Anthony P | $5,000 | None Available | |
| Hammill Anthony P | -- | None Available |
Source: Public Records
Mortgage History
| Date | Status | Borrower | Loan Amount |
|---|---|---|---|
| Closed | Otto John | $5,000 |
Source: Public Records
Tax History
| Year | Tax Paid | Tax Assessment Tax Assessment Total Assessment is a certain percentage of the fair market value that is determined by local assessors to be the total taxable value of land and additions on the property. | Land | Improvement |
|---|---|---|---|---|
| 2024 | $370 | $66,000 | $6,500 | $59,500 |
| 2023 | $334 | $66,000 | $6,500 | $59,500 |
| 2022 | $332 | $66,000 | $6,500 | $59,500 |
| 2021 | $332 | $66,000 | $6,500 | $59,500 |
| 2020 | $388 | $66,000 | $6,500 | $59,500 |
| 2019 | $1,383 | $50,400 | $5,500 | $44,900 |
| 2018 | $1,301 | $50,400 | $5,500 | $44,900 |
| 2017 | $300 | $50,400 | $5,500 | $44,900 |
| 2016 | $1,227 | $50,400 | $5,500 | $44,900 |
| 2015 | -- | $50,400 | $5,500 | $44,900 |
| 2014 | -- | $50,400 | $5,500 | $44,900 |
Source: Public Records
Map
Nearby Homes
- 1834 Seneca St
- 118 Remington Place
- 65 Hammerschmidt Ave
- 59 Hammerschmidt Ave
- 45 Unger Ave
- 28 Paul Place
- 75 Juniata Place
- 208 Stevenson St
- 102 Pomona Place
- 114 Sage Ave
- 110 Armin Place
- 129 Armin Place
- 18 S Ryan St
- 62 S Ryan St
- 80 Hayden St
- 85 Geary St
- 35 Kimmel Ave
- 417 Bailey Ave
- 836 Mckinley Pkwy
- 26 Kamper Ave
Your Personal Tour Guide
Ask me questions while you tour the home.