Estimated Value: $700,000 - $873,000
4
Beds
4
Baths
1,884
Sq Ft
$412/Sq Ft
Est. Value
About This Home
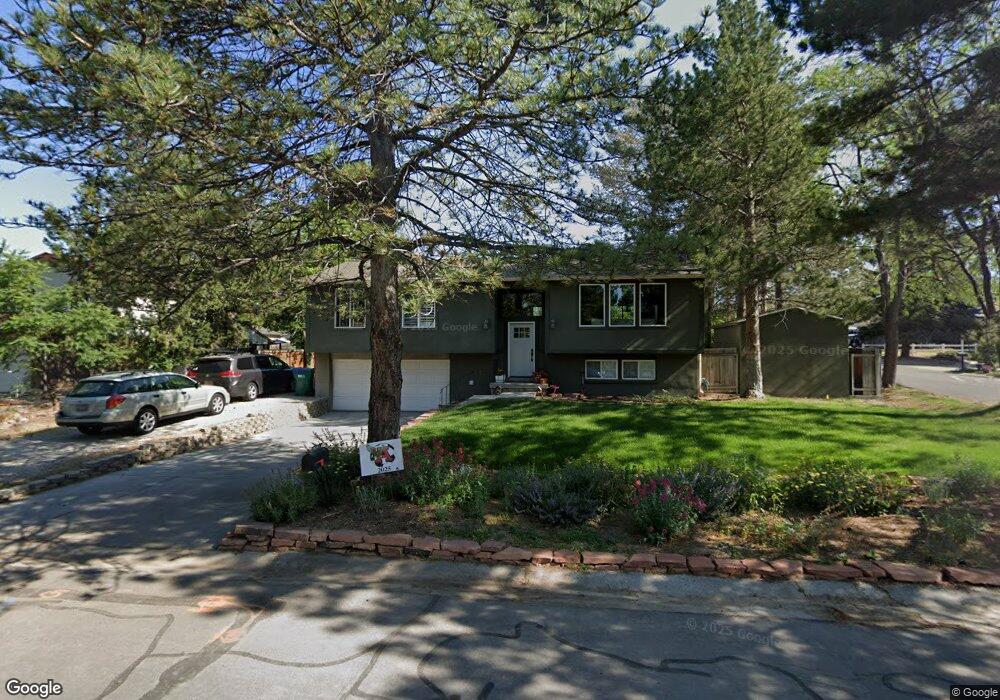
This home is located at 1795 E Ellen Way, Sandy, UT 84092 and is currently estimated at $776,875, approximately $412 per square foot. 1795 E Ellen Way is a home located in Salt Lake County with nearby schools including Sunrise Elementary School, Bell Canyon Montessori School, and Challenger School - Sandy.
Ownership History
Date
Name
Owned For
Owner Type
Purchase Details
Closed on
May 14, 2020
Sold by
Lems David B and Lems Shelia A
Bought by
Coccimiglio Frank Trace
Current Estimated Value
Home Financials for this Owner
Home Financials are based on the most recent Mortgage that was taken out on this home.
Original Mortgage
$360,000
Outstanding Balance
$319,010
Interest Rate
3.3%
Mortgage Type
New Conventional
Estimated Equity
$457,865
Purchase Details
Closed on
Jun 18, 1997
Sold by
Ketner Joel C and Ketner Judy E
Bought by
Lems David B and Lems Shelia A
Home Financials for this Owner
Home Financials are based on the most recent Mortgage that was taken out on this home.
Original Mortgage
$150,300
Interest Rate
7.94%
Create a Home Valuation Report for This Property
The Home Valuation Report is an in-depth analysis detailing your home's value as well as a comparison with similar homes in the area
Home Values in the Area
Average Home Value in this Area
Purchase History
| Date | Buyer | Sale Price | Title Company |
|---|---|---|---|
| Coccimiglio Frank Trace | -- | 1St Liberty Title Lc | |
| Lems David B | -- | -- |
Source: Public Records
Mortgage History
| Date | Status | Borrower | Loan Amount |
|---|---|---|---|
| Open | Coccimiglio Frank Trace | $360,000 | |
| Previous Owner | Lems David B | $150,300 |
Source: Public Records
Tax History
| Year | Tax Paid | Tax Assessment Tax Assessment Total Assessment is a certain percentage of the fair market value that is determined by local assessors to be the total taxable value of land and additions on the property. | Land | Improvement |
|---|---|---|---|---|
| 2025 | $3,609 | $703,300 | $313,200 | $390,100 |
| 2024 | $3,609 | $667,400 | $301,400 | $366,000 |
| 2023 | $3,267 | $602,500 | $289,800 | $312,700 |
| 2022 | $3,083 | $555,300 | $269,800 | $285,500 |
| 2021 | $2,661 | $408,000 | $214,700 | $193,300 |
| 2020 | $2,627 | $379,900 | $214,700 | $165,200 |
| 2019 | $2,653 | $373,900 | $209,100 | $164,800 |
| 2016 | $2,233 | $302,500 | $188,400 | $114,100 |
Source: Public Records
Map
Nearby Homes
- 10868 Prescott Dr
- 11318 Canyon Falls Ln
- 1653 Crescent View Dr
- 11382 S Canyon Falls Ln
- 2026 E 10765 S
- 11341 S Silver Buckle Way
- 11129 S 2125 E
- 7 Rollingwood Ln
- 16 Gatehouse Ln
- 11343 Clifford Cir
- 1320 E Woodhill Cir
- 1 Quietwood Ln
- 2234 E Willow Brook Way
- 5 Quietwood Ln
- 10538 S Bay Meadow Dr
- 2342 Charros Rd
- 2192 E High Mesa Dr
- 1602 E Sego Lily Dr
- 10665 S 2340 E
- 10286 S Edgecliff Dr
Your Personal Tour Guide
Ask me questions while you tour the home.