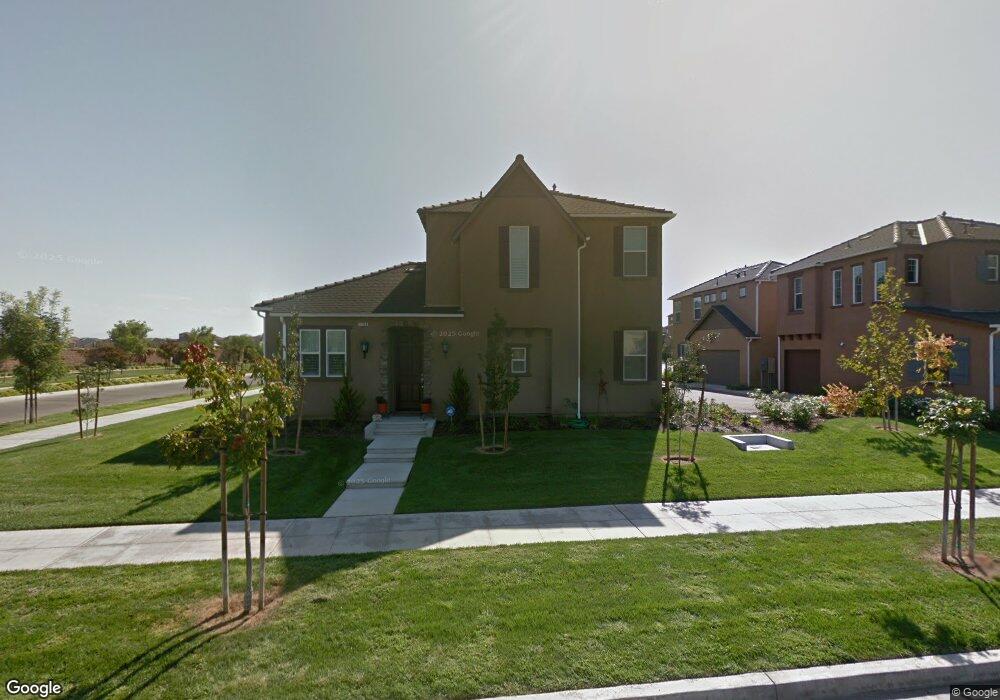
1799 N Leonard Ave Clovis, CA 93619
Estimated Value: $390,094 - $435,000
3
Beds
3
Baths
1,378
Sq Ft
$299/Sq Ft
Est. Value
About This Home
This home is located at 1799 N Leonard Ave, Clovis, CA 93619 and is currently estimated at $411,365, approximately $298 per square foot. 1799 N Leonard Ave is a home located in Fresno County with nearby schools including Bud Rank Elementary School, Granite Ridge Intermediate School, and Clovis North High School.
Ownership History
Date
Name
Owned For
Owner Type
Purchase Details
Closed on
Jul 21, 2015
Sold by
Cotter Anne B
Bought by
Cotter Anne Brolyer and Anne Brolyer Cotter Trust
Current Estimated Value
Purchase Details
Closed on
Dec 1, 2010
Sold by
52 At Harlan Ranch Lp
Bought by
Cotter Anne B
Purchase Details
Closed on
Apr 28, 2010
Sold by
Capri Court At Harlan Ranch Ii Lp
Bought by
52 At Harlan Ranch Lp
Purchase Details
Closed on
Apr 10, 2009
Sold by
Town & Country At Harlan Ranch Ii Lp
Bought by
Capri Court At Harlan Ranch Ii Lp
Purchase Details
Closed on
Dec 22, 2008
Sold by
Cvec Group Inc
Bought by
Town & Country At Harlan Ranch Ii Lp
Home Financials for this Owner
Home Financials are based on the most recent Mortgage that was taken out on this home.
Original Mortgage
$7,000,000
Interest Rate
6.1%
Mortgage Type
Purchase Money Mortgage
Create a Home Valuation Report for This Property
The Home Valuation Report is an in-depth analysis detailing your home's value as well as a comparison with similar homes in the area
Home Values in the Area
Average Home Value in this Area
Purchase History
| Date | Buyer | Sale Price | Title Company |
|---|---|---|---|
| Cotter Anne Brolyer | -- | None Available | |
| Cotter Anne B | $186,000 | Chicago Title Company | |
| 52 At Harlan Ranch Lp | $68,000 | Chicago Title Company | |
| Capri Court At Harlan Ranch Ii Lp | -- | Chicago Title Company | |
| Town & Country At Harlan Ranch Ii Lp | -- | Chicago Title Company |
Source: Public Records
Mortgage History
| Date | Status | Borrower | Loan Amount |
|---|---|---|---|
| Previous Owner | Town & Country At Harlan Ranch Ii Lp | $7,000,000 | |
| Closed | Capri Court At Harlan Ranch Ii Lp | $0 |
Source: Public Records
Tax History
| Year | Tax Paid | Tax Assessment Tax Assessment Total Assessment is a certain percentage of the fair market value that is determined by local assessors to be the total taxable value of land and additions on the property. | Land | Improvement |
|---|---|---|---|---|
| 2025 | $3,265 | $248,535 | $43,551 | $204,984 |
| 2023 | $3,130 | $238,886 | $41,861 | $197,025 |
| 2022 | $2,810 | $234,203 | $41,041 | $193,162 |
| 2021 | $2,711 | $229,612 | $40,237 | $189,375 |
| 2020 | $2,700 | $227,259 | $39,825 | $187,434 |
| 2019 | $2,903 | $222,804 | $39,045 | $183,759 |
| 2018 | $2,839 | $218,436 | $38,280 | $180,156 |
| 2017 | $2,788 | $214,154 | $37,530 | $176,624 |
| 2016 | $2,697 | $209,956 | $36,795 | $173,161 |
| 2015 | $2,651 | $206,803 | $36,243 | $170,560 |
| 2014 | $2,602 | $202,753 | $35,534 | $167,219 |
Source: Public Records
Map
Nearby Homes
- 3838 Moody Ln
- 1814 N Notting Hill Ln
- 1813 N Paddington Ln
- 1776 N Mcpherson Ln
- 1609 N Piccadilly Ln
- 3940 Chessa Ln
- 3560 Bloomfield Ln
- 3531 Alcove Way
- 3482 Elevations Way
- 1742 N Broadbent Ln
- 4153 Serena Ave
- 3396 Trenton Ave
- 4226 Serena Ln
- 4207 Serena Ln
- 1687 N Blackwood Ave
- 1675 N Blackwood Ave
- 3211 Salem Ave
- 3202 Everglade Ave
- 7747 E Nees Ave
- 8099 E Nees Ave
- 1772 N Dutch Ave
- 1795 N Leonard Ave
- 1794 N Merlan Ln
- 1787 N Leonard Ave
- 1786 N Merlan Ln
- 1764 N Dutch Ave
- 3819 Loyola Ln
- 1838 N Notting Hill Ln
- 3827 Loyola Ln
- 3818 Loyola Ln
- 1756 N Dutch Ave
- 1832 N Notting Hill Ln
- 1844 N Regent Ln
- 1782 N Merlan Ln
- 3826 Loyola Ln
- 1826 N Notting Hill Ln
- 1809 N Nicolette Ave
- 3811 Moody Ln
- 1774 N Merlan Ln
- 3834 Loyola Ln
Your Personal Tour Guide
Ask me questions while you tour the home.