
18 Hawthorne Rd Windham, NH 03087
Estimated payment $7,993/month
Highlights
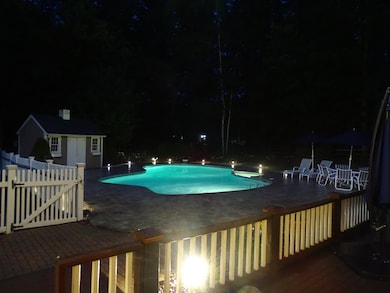
- Spa
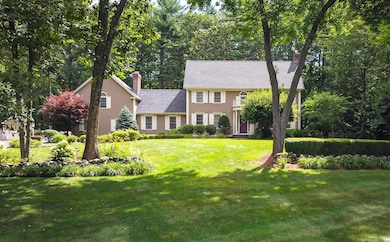
- Colonial Architecture
- 2 Car Attached Garage
- Golden Brook Elementary School Rated A-
- Wood Flooring
- Patio
About This Home
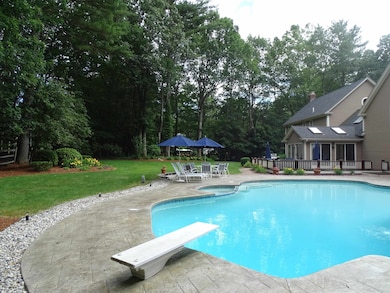
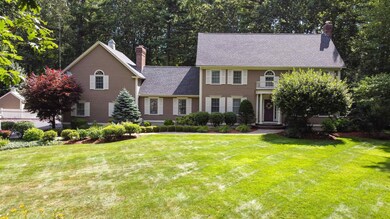
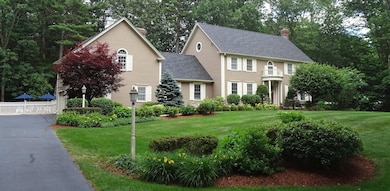
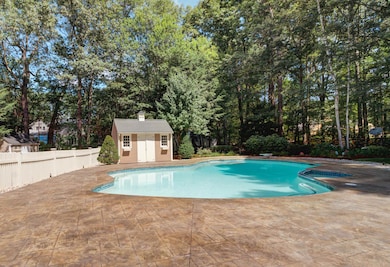
Welcome to this timeless Colonial nestled in one of Windham NH most coveted neighborhoods. Offering over 4,700 square feet of elegant living space, this exceptional home blends traditional charm with luxurious amenities perfect for both everyday living and grand entertaining. Step inside to find spacious, light-filled rooms, rich hardwood flooring, and classic architectural details throughout. The main level offers a seamless flow between formal and casual spaces, including a sun-drenched family room and four-season room, elegant dining area and a beautiful, designed kitchen. Upstairs you'll find 4 generously sized bedrooms that provide comfort and privacy for the whole family, while the finished basement is an entertainer’s dream complete with a wet bar, full bathroom, and relaxing sauna for the ultimate in-home retreat. Outside, the stunning mature landscaping creates a private oasis, featuring an oversized in-ground pool and hot tub surrounded by lush greenery and elegant hardscaping perfect for summer gatherings or peaceful relaxation. This is a rare opportunity to own a truly special home in one of Windham’s premier neighborhoods. Don’t miss your chance to experience the perfect blend of comfort, style, and resort-like living.
Home Details
Home Type
- Single Family
Est. Annual Taxes
- $16,928
Year Built
- Built in 1987
Lot Details
- 1.2 Acre Lot
- Property fronts a private road
- Level Lot
- Irrigation Equipment
Parking
- 2 Car Attached Garage
- Automatic Garage Door Opener
- Driveway
Home Design
- Colonial Architecture
- Wood Frame Construction
- Wood Siding
Interior Spaces
- Property has 2 Levels
- Dishwasher
Flooring
- Wood
- Tile
Bedrooms and Bathrooms
- 4 Bedrooms
Basement
- Heated Basement
- Interior Basement Entry
Outdoor Features
- Spa
- Patio
Schools
- Golden Brook Elementary School
- Windham Middle School
- Windham High School
Utilities
- Central Air
- Power Generator
- Private Water Source
- Drilled Well
- Water Purifier
- Septic Tank
- Cable TV Available
Listing and Financial Details
- Legal Lot and Block 243 / A
- Assessor Parcel Number 5
Map
Home Values in the Area
Average Home Value in this Area
Tax History
| Year | Tax Paid | Tax Assessment Tax Assessment Total Assessment is a certain percentage of the fair market value that is determined by local assessors to be the total taxable value of land and additions on the property. | Land | Improvement |
|---|---|---|---|---|
| 2024 | $16,928 | $747,700 | $211,900 | $535,800 |
| 2023 | $16,001 | $747,700 | $211,900 | $535,800 |
| 2022 | $14,775 | $747,700 | $211,900 | $535,800 |
| 2021 | $13,818 | $742,100 | $211,900 | $530,200 |
| 2020 | $14,196 | $742,100 | $211,900 | $530,200 |
| 2019 | $13,841 | $613,800 | $193,800 | $420,000 |
| 2018 | $14,295 | $613,800 | $193,800 | $420,000 |
| 2017 | $12,419 | $614,800 | $193,800 | $421,000 |
| 2016 | $13,415 | $614,800 | $193,800 | $421,000 |
| 2015 | $13,475 | $620,400 | $193,800 | $426,600 |
| 2014 | $13,567 | $565,300 | $221,000 | $344,300 |
| 2013 | $13,131 | $556,400 | $221,000 | $335,400 |
Property History
| Date | Event | Price | List to Sale | Price per Sq Ft |
|---|---|---|---|---|
| 08/05/2025 08/05/25 | Price Changed | $1,250,000 | -10.5% | $266 / Sq Ft |
| 07/22/2025 07/22/25 | For Sale | $1,397,000 | -- | $297 / Sq Ft |
Purchase History
| Date | Type | Sale Price | Title Company |
|---|---|---|---|
| Warranty Deed | $390,000 | -- |
Mortgage History
| Date | Status | Loan Amount | Loan Type |
|---|---|---|---|
| Open | $214,000 | No Value Available |
Source: PrimeMLS
MLS Number: 5052680
APN: WNDM-000005-A000000-000243
Disclaimer: Certain information contained herein is derived from information provided by parties other than Homes.com. All information provided is deemed reliable, but is not guaranteed to be accurate and should be independently verified.
![]() Copyright 2025 PrimeMLS, Inc. All rights reserved. This information is deemed reliable, but not guaranteed. The data relating to real estate displayed on this display comes in part from the IDX Program of PrimeMLS. The information being provided is for consumers’ personal, non-commercial use and may not be used for any purpose other than to identify prospective properties consumers may be interested in purchasing.
Copyright 2025 PrimeMLS, Inc. All rights reserved. This information is deemed reliable, but not guaranteed. The data relating to real estate displayed on this display comes in part from the IDX Program of PrimeMLS. The information being provided is for consumers’ personal, non-commercial use and may not be used for any purpose other than to identify prospective properties consumers may be interested in purchasing.
- 11 Park St
- Lot 5 Plan at Highclere
- 7 Cardinal Rd
- 9 Cardinal Rd
- 6 Londonderry Rd
- 49 Hickory Ln
- 97 Kendall Pond Rd
- 64 Stacey Cir
- 7 Camelot Rd
- 149 Londonderry Rd
- 13 Gertrude Rd
- 18 Nottingham Rd
- 1 Joan St
- 7 Oakwood St
- 171 Londonderry Rd
- 7 Buckhide Rd
- 34 Pleasant Dr
- 2 Brown Rd
- 87 Oakridge Dr
- 69 Oakridge Dr
- 124 Mammoth Rd
- 13 Bear Hill Rd
- 5 Kinsman Ln
- 1 Charleston Ave
- 7 Elise Ave
- 70 Fordway Extension Unit 102
- 65 Fordway Extension Unit 6
- 67 Rockingham Rd Unit A-1
- 62 W Shore Rd
- 15 Winding Pond Rd
- 1 Florence St Unit B
- 56 S Shore Rd
- 30 Main St
- 4 Mc Gregor St Unit A - 1st Floor
- 53 W Broadway
- 12 Central St Unit Bottom Floor
- 12 Central St Unit Top Floor
- 12 Central St Unit bottom fl
- 17 Central St Unit . 4
- 41 Gov Bell Dr
