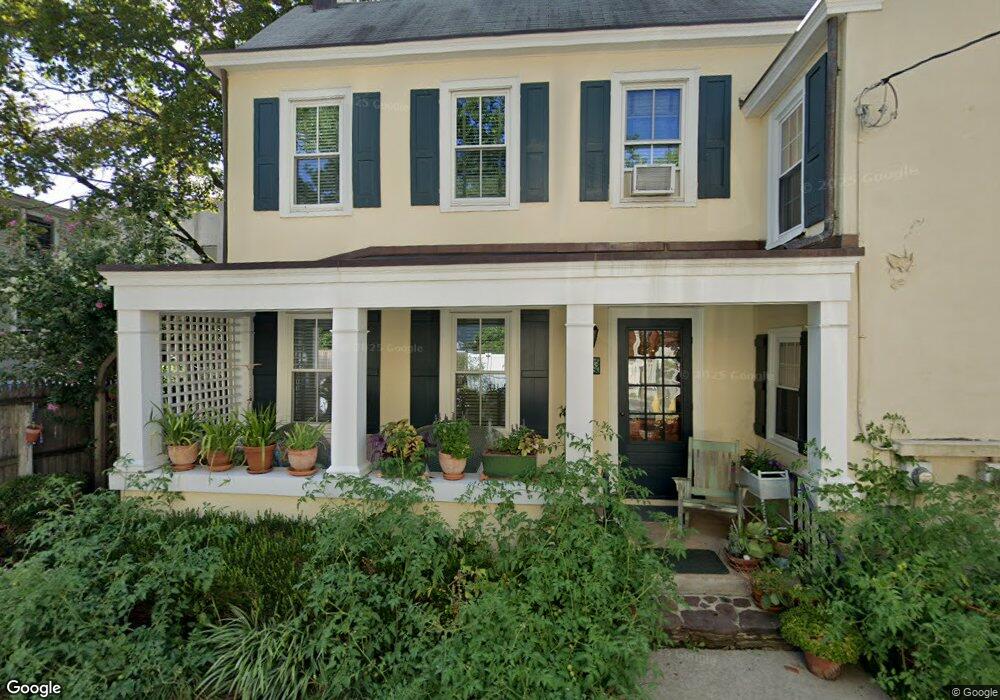
18 Pine St Princeton, NJ 08542
Estimated Value: $1,022,000 - $1,292,000
--
Bed
--
Bath
2,020
Sq Ft
$564/Sq Ft
Est. Value
About This Home
This home is located at 18 Pine St, Princeton, NJ 08542 and is currently estimated at $1,138,474, approximately $563 per square foot. 18 Pine St is a home located in Mercer County with nearby schools including Community Park Elementary School, Princeton Middle School, and Princeton High School.
Ownership History
Date
Name
Owned For
Owner Type
Purchase Details
Closed on
Apr 19, 2000
Sold by
Willard David
Bought by
Simonds Barbara
Current Estimated Value
Home Financials for this Owner
Home Financials are based on the most recent Mortgage that was taken out on this home.
Original Mortgage
$203,953
Outstanding Balance
$69,773
Interest Rate
8.21%
Estimated Equity
$1,068,701
Purchase Details
Closed on
Oct 1, 1993
Sold by
Procaccini Frank
Bought by
Willard David
Home Financials for this Owner
Home Financials are based on the most recent Mortgage that was taken out on this home.
Original Mortgage
$181,000
Interest Rate
6.87%
Create a Home Valuation Report for This Property
The Home Valuation Report is an in-depth analysis detailing your home's value as well as a comparison with similar homes in the area
Home Values in the Area
Average Home Value in this Area
Purchase History
| Date | Buyer | Sale Price | Title Company |
|---|---|---|---|
| Simonds Barbara | $313,775 | -- | |
| Willard David | $212,500 | -- |
Source: Public Records
Mortgage History
| Date | Status | Borrower | Loan Amount |
|---|---|---|---|
| Open | Simonds Barbara | $203,953 | |
| Previous Owner | Willard David | $181,000 |
Source: Public Records
Tax History Compared to Growth
Tax History
| Year | Tax Paid | Tax Assessment Tax Assessment Total Assessment is a certain percentage of the fair market value that is determined by local assessors to be the total taxable value of land and additions on the property. | Land | Improvement |
|---|---|---|---|---|
| 2025 | $16,399 | $615,800 | $366,000 | $249,800 |
| 2024 | $15,481 | $615,800 | $366,000 | $249,800 |
| 2023 | $15,481 | $615,800 | $366,000 | $249,800 |
| 2022 | $14,738 | $606,000 | $366,000 | $240,000 |
| 2021 | $14,780 | $606,000 | $366,000 | $240,000 |
| 2020 | $14,415 | $606,000 | $366,000 | $240,000 |
| 2019 | $14,035 | $591,700 | $441,000 | $150,700 |
| 2018 | $13,798 | $591,700 | $441,000 | $150,700 |
| 2017 | $13,294 | $578,000 | $441,000 | $137,000 |
| 2016 | $13,086 | $578,000 | $441,000 | $137,000 |
| 2015 | $12,785 | $578,000 | $441,000 | $137,000 |
| 2014 | $12,629 | $578,000 | $441,000 | $137,000 |
Source: Public Records
Map
Nearby Homes
- 57 Moran Ave
- 17 Aiken Ave
- 36 Moore St Unit 6
- 56 Patton Ave
- 16 Cameron Ct
- 22 Gordon Way
- 1 Markham Rd Unit 2C
- 1 Markham Rd Unit 1D
- 189 Moore St
- 98 Nassau St Unit 3
- 3 Harris Rd
- 722 Avery Ln
- 721 Avery Ln
- 380 Franklin Ave
- 428 Nassau St
- 132 Victoria Mews
- 20 Paul Robeson Place
- 49 Palmer Square W Unit D
- 261 Moore St
- 48 Nassau St Unit I