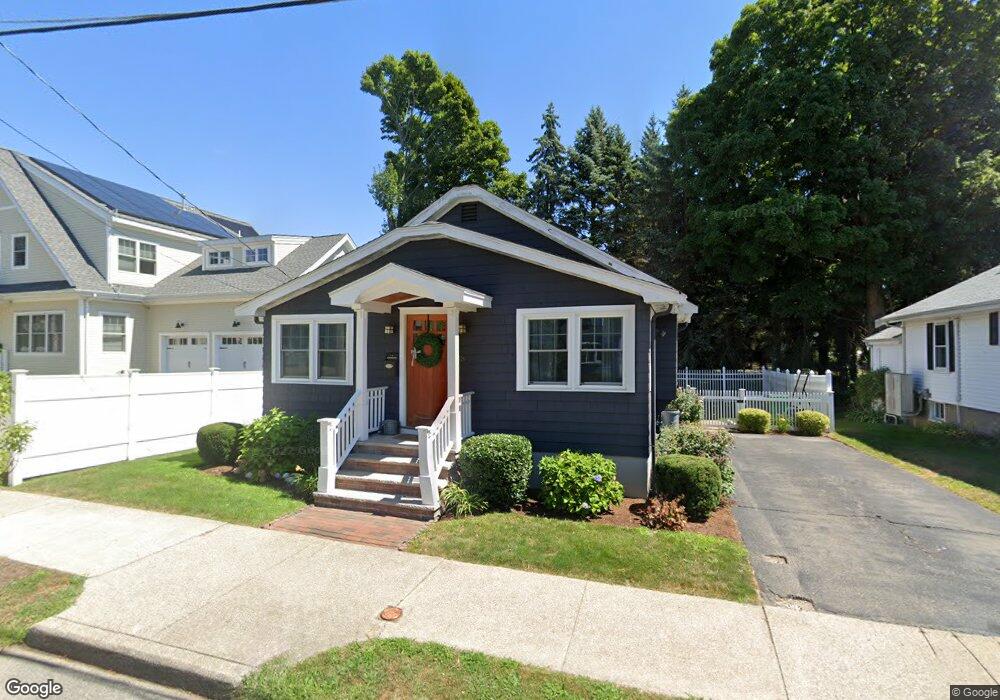
18 Talbot St West Newton, MA 02465
West Newton NeighborhoodEstimated Value: $763,080 - $1,030,000
2
Beds
1
Bath
1,103
Sq Ft
$791/Sq Ft
Est. Value
About This Home
This home is located at 18 Talbot St, West Newton, MA 02465 and is currently estimated at $872,520, approximately $791 per square foot. 18 Talbot St is a home located in Middlesex County with nearby schools including Franklin Elementary School, F.A. Day Middle School, and Newton North High School.
Ownership History
Date
Name
Owned For
Owner Type
Purchase Details
Closed on
Jun 29, 2007
Sold by
Cornfeldt Alison and Cornfeldt Jeremy
Bought by
Marchand Emily M and Marchand Scott D
Current Estimated Value
Home Financials for this Owner
Home Financials are based on the most recent Mortgage that was taken out on this home.
Original Mortgage
$318,500
Outstanding Balance
$196,354
Interest Rate
6.24%
Mortgage Type
Purchase Money Mortgage
Estimated Equity
$676,166
Create a Home Valuation Report for This Property
The Home Valuation Report is an in-depth analysis detailing your home's value as well as a comparison with similar homes in the area
Home Values in the Area
Average Home Value in this Area
Purchase History
| Date | Buyer | Sale Price | Title Company |
|---|---|---|---|
| Marchand Emily M | $433,500 | -- |
Source: Public Records
Mortgage History
| Date | Status | Borrower | Loan Amount |
|---|---|---|---|
| Open | Marchand Emily M | $318,500 |
Source: Public Records
Tax History Compared to Growth
Tax History
| Year | Tax Paid | Tax Assessment Tax Assessment Total Assessment is a certain percentage of the fair market value that is determined by local assessors to be the total taxable value of land and additions on the property. | Land | Improvement |
|---|---|---|---|---|
| 2025 | $6,212 | $633,900 | $0 | $0 |
| 2024 | $6,006 | $0 | $0 | $0 |
| 2023 | $5,654 | $555,400 | $520,900 | $34,500 |
| 2022 | $5,410 | $514,300 | $482,300 | $32,000 |
| 2021 | $5,221 | $485,200 | $455,000 | $30,200 |
| 2020 | $5,065 | $485,200 | $455,000 | $30,200 |
| 2019 | $4,923 | $471,100 | $441,700 | $29,400 |
| 2018 | $4,610 | $426,100 | $401,500 | $24,600 |
| 2017 | $4,470 | $402,000 | $378,800 | $23,200 |
| 2016 | $4,275 | $375,700 | $354,000 | $21,700 |
| 2015 | $4,586 | $395,000 | $330,800 | $64,200 |
Source: Public Records
Map
Nearby Homes
- 41 Kilburn Rd
- 287 Cherry St Unit 2
- 44 Westland Ave
- 56 Dearborn St
- 75 Cherry St
- 14 Cottage Place Unit 14
- 106 River St Unit 18
- 106 River St Unit 2
- 106 River St Unit 14
- 2 Elm St Unit 6
- 2 Elm St Unit 8
- 371 Cherry St
- 76 Taft Ave Unit 1
- 76 Taft Ave
- 76 Taft Ave Unit 2
- 76 Harding St
- 265-267 River St Unit 267
- 265-267 River St Unit 265
- 24 Tolman St Unit A
- 90 Auburndale Ave
- 14 Talbot St
- 24 Talbot St
- 28 Talbot St
- 17 Talbot St
- 21 Talbot St
- 11 Talbot St
- 30 Talbot St
- 6 Talbot St
- 52 Derby St
- 27-29 Talbot St
- 27-29 Talbot St Unit 2ND FLR
- 27 Talbot St Unit 29
- 27 Talbot St Unit 2nd Floor
- 60 Derby St
- 32 Talbot St
- 56 Derby St
- 56 Derby St Unit 56
- 43 Harris Rd
- 5 Talbot St
- 220 Cherry St