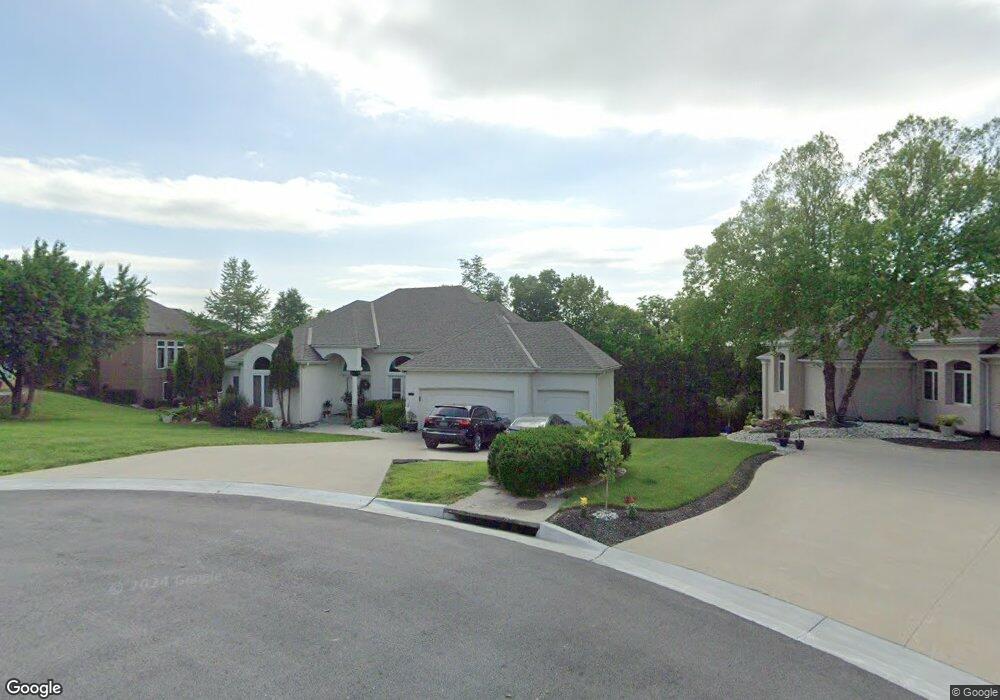
180 NE Hidden Ridge Place Lees Summit, MO 64064
Chapel Ridge NeighborhoodEstimated Value: $504,000 - $535,000
3
Beds
3
Baths
2,063
Sq Ft
$251/Sq Ft
Est. Value
About This Home
This home is located at 180 NE Hidden Ridge Place, Lees Summit, MO 64064 and is currently estimated at $516,806, approximately $250 per square foot. 180 NE Hidden Ridge Place is a home located in Jackson County with nearby schools including Voy Spears Jr. Elementary School, Delta Woods Middle School, and Blue Springs South High School.
Ownership History
Date
Name
Owned For
Owner Type
Purchase Details
Closed on
Dec 14, 2005
Sold by
Deangelo Anthony M
Bought by
Deangelo Ceryse P
Current Estimated Value
Home Financials for this Owner
Home Financials are based on the most recent Mortgage that was taken out on this home.
Original Mortgage
$301,000
Outstanding Balance
$165,497
Interest Rate
6%
Mortgage Type
Fannie Mae Freddie Mac
Estimated Equity
$351,309
Purchase Details
Closed on
Nov 8, 2001
Sold by
Harry Lutz Homes Inc
Bought by
Deangelo Anthony M and Deangelo Ceryse P
Home Financials for this Owner
Home Financials are based on the most recent Mortgage that was taken out on this home.
Original Mortgage
$275,000
Interest Rate
6.59%
Mortgage Type
Purchase Money Mortgage
Purchase Details
Closed on
Feb 5, 2001
Sold by
Diamond Development North Inc
Bought by
Harry Lutz Homes Inc
Home Financials for this Owner
Home Financials are based on the most recent Mortgage that was taken out on this home.
Original Mortgage
$266,000
Interest Rate
7.13%
Mortgage Type
Construction
Create a Home Valuation Report for This Property
The Home Valuation Report is an in-depth analysis detailing your home's value as well as a comparison with similar homes in the area
Home Values in the Area
Average Home Value in this Area
Purchase History
| Date | Buyer | Sale Price | Title Company |
|---|---|---|---|
| Deangelo Ceryse P | -- | Capital Title Agency Inc | |
| Deangelo Anthony M | -- | Security Land Title Company | |
| Harry Lutz Homes Inc | -- | Security Land Title Company |
Source: Public Records
Mortgage History
| Date | Status | Borrower | Loan Amount |
|---|---|---|---|
| Open | Deangelo Ceryse P | $301,000 | |
| Previous Owner | Deangelo Anthony M | $275,000 | |
| Previous Owner | Harry Lutz Homes Inc | $266,000 | |
| Closed | Deangelo Anthony M | $40,000 |
Source: Public Records
Tax History Compared to Growth
Tax History
| Year | Tax Paid | Tax Assessment Tax Assessment Total Assessment is a certain percentage of the fair market value that is determined by local assessors to be the total taxable value of land and additions on the property. | Land | Improvement |
|---|---|---|---|---|
| 2025 | $5,806 | $87,181 | $20,151 | $67,030 |
| 2024 | $5,701 | $75,810 | $18,267 | $57,543 |
| 2023 | $5,701 | $75,810 | $13,266 | $62,544 |
| 2022 | $6,857 | $80,750 | $19,114 | $61,636 |
| 2021 | $6,851 | $80,750 | $19,114 | $61,636 |
| 2020 | $6,471 | $75,433 | $19,114 | $56,319 |
| 2019 | $6,273 | $75,433 | $19,114 | $56,319 |
| 2018 | $5,622 | $65,579 | $9,801 | $55,778 |
| 2017 | $5,583 | $65,579 | $9,801 | $55,778 |
| 2016 | $5,583 | $65,341 | $11,343 | $53,998 |
| 2014 | $5,738 | $66,738 | $9,470 | $57,268 |
Source: Public Records
Map
Nearby Homes
- 5605 NE Misty Meadow Place
- 5556 NW Moonlight Meadow Dr
- 5416 NE Northgate Crossing
- 5570 NW Sunrise Meadow Ln
- 5808 NE Coral Dr
- 120 NE Hidden Meadow Ct
- 5623 NW Sunrise Meadow Cir
- 400 NE Emerald Dr
- 5854 NW Plantation Ln
- 5664 NW Plantation Dr
- 5900 NE Hidden Valley Dr
- 5611 NW Plantation Ln
- 5712 NW Plantation Ln
- 5136 NE Ash Grove Dr
- 5937 NE Hidden Valley Dr
- 332 NE Parks Edge Dr
- 425 NE Saint Andrews Cir
- 704 NE Diamond Ln
- 5410 S Coachman Ave
- 5436 S Coachman Ave
- 184 NE Hidden Ridge Place
- 168 NE Hidden Ridge Ln
- 172 NE Hidden Ridge Ln
- 188 NE Hidden Ridge Place
- 164 NE Hidden Ridge Ln
- 176 NE Hidden Ridge Ln
- 192 NE Hidden Ridge Place
- 173 NE Hidden Ridge Ln
- 196 NE Hidden Ridge Place
- 177 NE Hidden Ridge Ln
- 181 NE Hidden Ridge Ln
- 160 NE Hidden Ridge Ln
- 169 NE Hidden Ridge Ln
- 200 NE Hidden Ridge Ln
- 181 NE Hidden Ridge Way
- 5517 NE Maybrook Rd
- 201 NE Hidden Ridge Ln
- 5521 NE Maybrook Rd
- 5601 NE Misty Meadow Place
- 5600 NE Misty Meadow Place