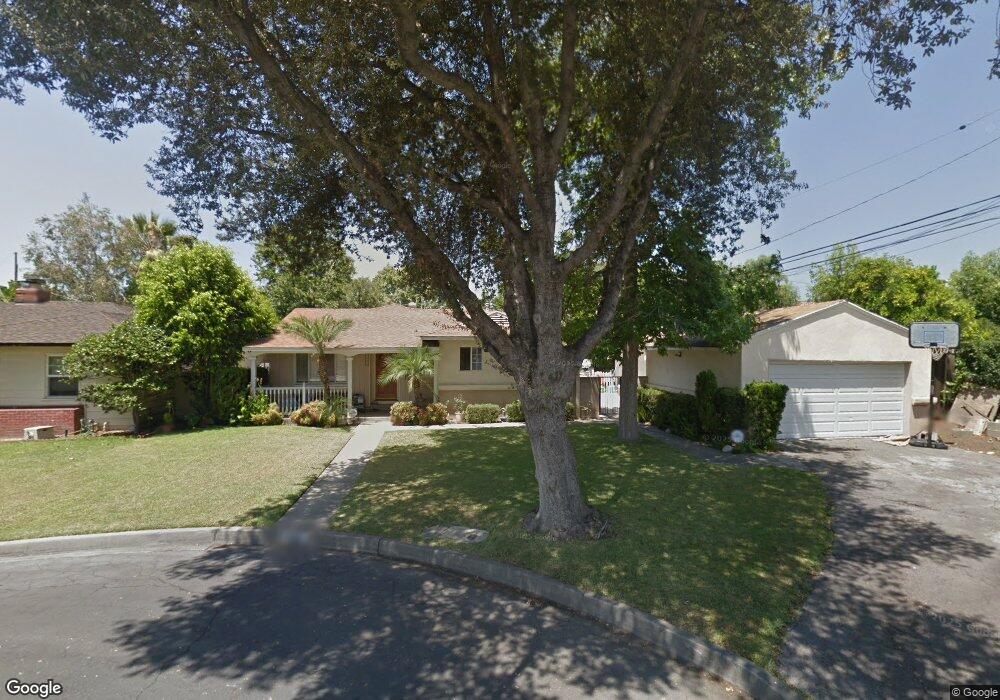
1801 S 7th Place Arcadia, CA 91006
Estimated Value: $1,340,000 - $1,954,189
3
Beds
3
Baths
1,521
Sq Ft
$1,060/Sq Ft
Est. Value
About This Home
This home is located at 1801 S 7th Place, Arcadia, CA 91006 and is currently estimated at $1,611,797, approximately $1,059 per square foot. 1801 S 7th Place is a home located in Los Angeles County with nearby schools including Camino Grove Elementary School, Richard Henry Dana Middle School, and Arcadia High School.
Ownership History
Date
Name
Owned For
Owner Type
Purchase Details
Closed on
Apr 9, 2002
Sold by
Zou Yingbo and Qiu Liming
Bought by
Fang Steven and Chow Anita
Current Estimated Value
Home Financials for this Owner
Home Financials are based on the most recent Mortgage that was taken out on this home.
Original Mortgage
$360,000
Outstanding Balance
$152,109
Interest Rate
7.08%
Estimated Equity
$1,459,688
Purchase Details
Closed on
Nov 13, 2001
Sold by
Liao Shee
Bought by
Zou Yingbo and Qiu Liming
Home Financials for this Owner
Home Financials are based on the most recent Mortgage that was taken out on this home.
Original Mortgage
$217,000
Interest Rate
7.14%
Purchase Details
Closed on
Jul 25, 2001
Sold by
Liu Hsiao Heng
Bought by
Liao Shee
Home Financials for this Owner
Home Financials are based on the most recent Mortgage that was taken out on this home.
Original Mortgage
$224,000
Interest Rate
6.91%
Create a Home Valuation Report for This Property
The Home Valuation Report is an in-depth analysis detailing your home's value as well as a comparison with similar homes in the area
Home Values in the Area
Average Home Value in this Area
Purchase History
| Date | Buyer | Sale Price | Title Company |
|---|---|---|---|
| Fang Steven | $455,000 | Stewart Title | |
| Zou Yingbo | $310,000 | Fidelity Title | |
| Qiu Liming | -- | Fidelity Title | |
| Zou Yingbo | -- | Fidelity Title | |
| Liao Shee | $280,000 | Fidelity Title |
Source: Public Records
Mortgage History
| Date | Status | Borrower | Loan Amount |
|---|---|---|---|
| Open | Fang Steven | $360,000 | |
| Previous Owner | Zou Yingbo | $217,000 | |
| Previous Owner | Liao Shee | $224,000 |
Source: Public Records
Tax History
| Year | Tax Paid | Tax Assessment Tax Assessment Total Assessment is a certain percentage of the fair market value that is determined by local assessors to be the total taxable value of land and additions on the property. | Land | Improvement |
|---|---|---|---|---|
| 2025 | $10,898 | $956,481 | $440,522 | $515,959 |
| 2024 | $10,898 | $937,728 | $431,885 | $505,843 |
| 2023 | $10,672 | $919,342 | $423,417 | $495,925 |
| 2022 | $10,326 | $901,316 | $415,115 | $486,201 |
| 2021 | $10,130 | $883,644 | $406,976 | $476,668 |
| 2019 | $9,886 | $857,436 | $394,905 | $462,531 |
| 2018 | $9,626 | $840,624 | $387,162 | $453,462 |
| 2016 | $6,676 | $567,801 | $372,129 | $195,672 |
| 2015 | $6,560 | $559,273 | $366,540 | $192,733 |
| 2014 | $6,474 | $548,318 | $359,360 | $188,958 |
Source: Public Records
Map
Nearby Homes
- 521 Danimere Ave
- 2107 S 5th Ave
- 1431 S 6th Ave
- 2809 Weidermeyer Ave
- 2813 Weidermeyer Ave
- 2808 Weidermeyer Ave
- 416 Jeffries Ave Unit 60
- 416 Jeffries Ave Unit 84
- 416 Jeffries Ave Unit 86
- 1318 S 8th Ave
- 185 E Norman Ave
- 2880 Foss Ave
- 1227 S 8th Ave
- 1825 Lee Ave
- 4185 Jasmine Ln
- 4183 Jasmine Ln
- 4201 Jasmine Ln
- 4181 Jasmine Ln
- 4203 Jasmine Ln
- 4179 Jasmine Ln
- 1809 S 7th Place
- 1804 S 7th Ave
- 1810 S 7th Ave
- 700 E Norman Ave
- 634 E Norman Ave
- 1800 S 7th Place
- 706 E Norman Ave
- 1815 S 7th Place
- 1808 S 7th Place
- 630 E Norman Ave
- 710 E Norman Ave
- 1816 S 7th Ave
- 1814 S 7th Place
- 624 E Norman Ave
- 1819 S 7th Place
- 1729 S 8th Ave
- 1801 S 8th Ave
- 1807 S 8th Ave
- 1822 S 7th Ave
- 1805 S 7th Ave
Your Personal Tour Guide
Ask me questions while you tour the home.