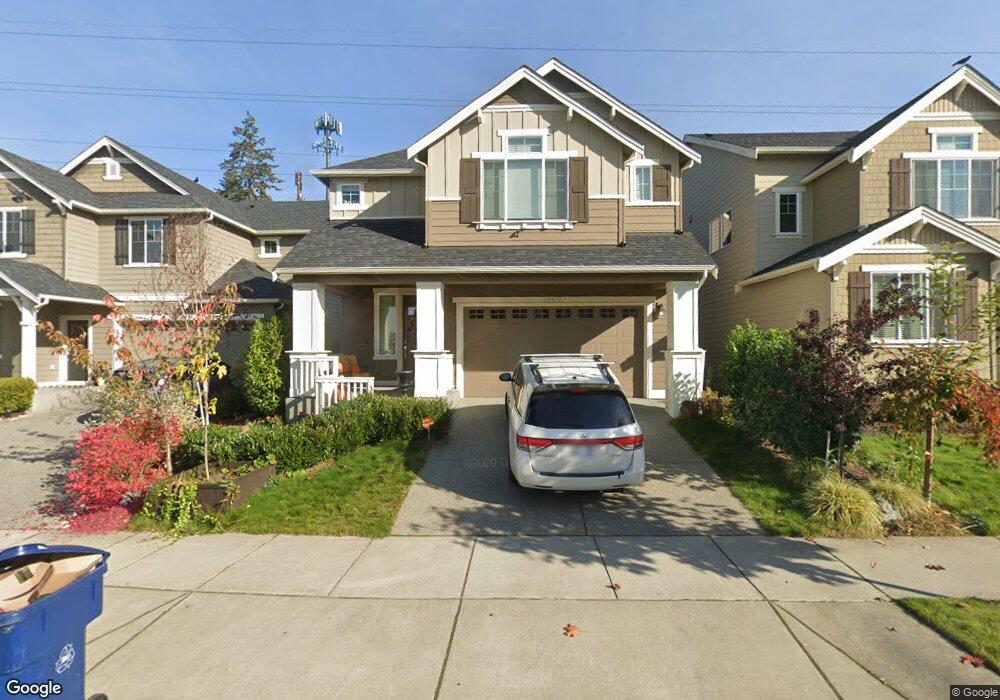
18015 42nd Dr SE Bothell, WA 98012
North Creek NeighborhoodEstimated Value: $1,174,000 - $1,314,479
4
Beds
3
Baths
2,831
Sq Ft
$439/Sq Ft
Est. Value
About This Home
This home is located at 18015 42nd Dr SE, Bothell, WA 98012 and is currently estimated at $1,242,370, approximately $438 per square foot. 18015 42nd Dr SE is a home located in Snohomish County with nearby schools including Ruby Bridges Elementary School, Skyview Middle School, and North Creek High School.
Ownership History
Date
Name
Owned For
Owner Type
Purchase Details
Closed on
Sep 7, 2017
Sold by
Gifford Holly D
Bought by
Garrison Christopher
Current Estimated Value
Home Financials for this Owner
Home Financials are based on the most recent Mortgage that was taken out on this home.
Original Mortgage
$424,000
Outstanding Balance
$348,934
Interest Rate
3.9%
Mortgage Type
New Conventional
Estimated Equity
$893,436
Purchase Details
Closed on
Jul 20, 2017
Sold by
Gifford Justin B
Bought by
Gifford Holly D
Home Financials for this Owner
Home Financials are based on the most recent Mortgage that was taken out on this home.
Original Mortgage
$424,000
Outstanding Balance
$348,934
Interest Rate
3.9%
Mortgage Type
New Conventional
Estimated Equity
$893,436
Purchase Details
Closed on
Dec 14, 2013
Sold by
Brookfield At Mill Creek Llc
Bought by
Gifford Justin B and Gifford Holly D
Home Financials for this Owner
Home Financials are based on the most recent Mortgage that was taken out on this home.
Original Mortgage
$522,425
Interest Rate
4.13%
Mortgage Type
VA
Create a Home Valuation Report for This Property
The Home Valuation Report is an in-depth analysis detailing your home's value as well as a comparison with similar homes in the area
Home Values in the Area
Average Home Value in this Area
Purchase History
We collect this data history from publicly available records. To have your information removed, we recommend requesting removal directly through your county’s website.
| Date | Buyer | Sale Price | Title Company |
|---|---|---|---|
| Garrison Christopher | $530,000 | Bct Linear Title & Closing | |
| Gifford Holly D | -- | None Available | |
| Gifford Justin B | $530,180 | Chicago Title |
Source: Public Records
Mortgage History
We collect this data history from publicly available records. To have your information removed, we recommend requesting removal directly through your county’s website.
| Date | Status | Borrower | Loan Amount |
|---|---|---|---|
| Open | Garrison Christopher | $424,000 | |
| Previous Owner | Gifford Justin B | $522,425 |
Source: Public Records
Tax History
| Year | Tax Paid | Tax Assessment Tax Assessment Total Assessment is a certain percentage of the fair market value that is determined by local assessors to be the total taxable value of land and additions on the property. | Land | Improvement |
|---|---|---|---|---|
| 2026 | $9,723 | $1,267,800 | $803,300 | $464,500 |
| 2025 | $8,937 | $1,105,900 | $653,900 | $452,000 |
| 2024 | $8,937 | $1,016,600 | $574,900 | $441,700 |
| 2023 | $9,285 | $1,179,200 | $663,300 | $515,900 |
| 2022 | $8,264 | $833,200 | $395,200 | $438,000 |
| 2020 | $7,846 | $747,100 | $372,400 | $374,700 |
| 2019 | $6,860 | $660,900 | $289,800 | $371,100 |
| 2018 | $6,440 | $577,900 | $247,000 | $330,900 |
| 2017 | $5,901 | $540,700 | $208,300 | $332,400 |
| 2016 | $5,857 | $512,100 | $190,300 | $321,800 |
| 2015 | $6,028 | $501,300 | $175,100 | $326,200 |
Source: Public Records
Map
Nearby Homes
- 4117 177th Place SE
- 4109 177th St SE
- 17913 38th Dr SE Unit 20
- 3931 177th St SE
- 4413 185th Place SE
- 4416 185th Place SE
- 4319 186th Place SE
- 18530 46th Ave SE
- 17905 35th Ave SE Unit B4
- 18213 36th Ave SE Unit 68
- 17633 48th Ave SE
- 18726 43rd Dr SE
- 17312 40th Ave SE
- 17227 39th Dr SE
- 3514 184th Place SE
- 3414 176th Place SE
- 18612 51st Ave SE
- 17903 33rd Ave SE
- 18725 35th Dr SE
- 3228 177th Place SE
- 18015 42nd Lot 7 Dr SE
- 18021 42nd Dr SE
- 18011 42nd Dr SE
- 4216 180th St SE
- 18027 42nd Dr SE
- 4221 180th Place SE
- 4215 180th Place SE
- 4209 180th Place SE
- 18016 42nd Dr SE
- 18022 42nd Lot 15 Dr SE
- 4312 180th St SE
- 4203 180th Place SE
- 18028 42nd Lot 14 Dr SE
- 4303 181st St SE Unit Lot 1
- 4232 181st Lot 10 St SE
- 4232 181st St SE Unit LOT10
- 4232 181st St SE
- 4222 181st St SE
- 18010 43rd Dr SE Unit Lot 3
- 18010 43rd Dr SE Unit 3
Your Personal Tour Guide
Ask me questions while you tour the home.