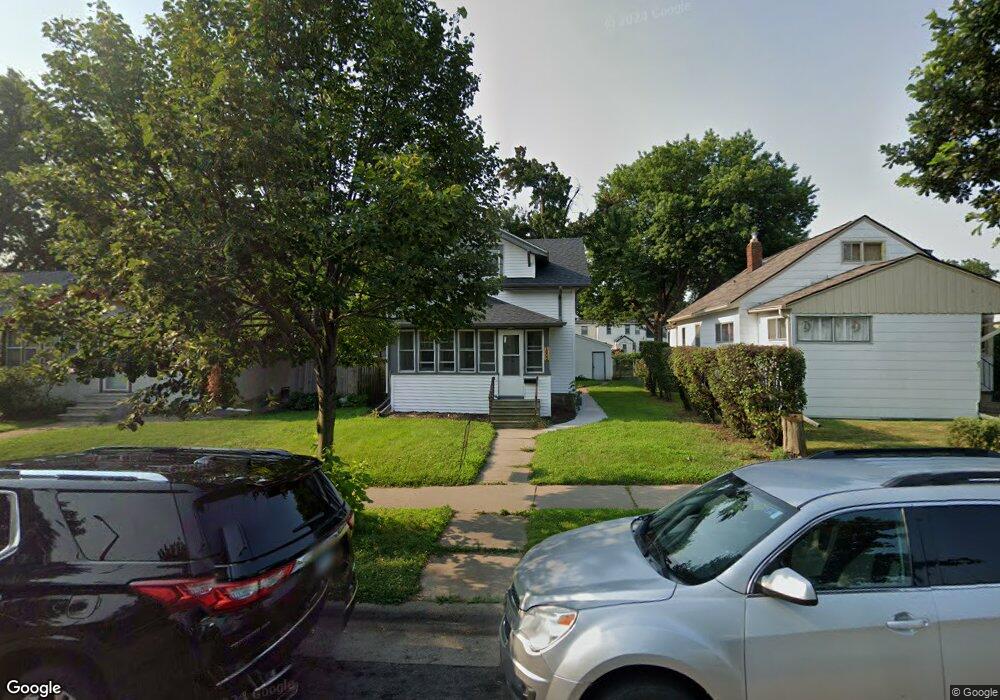
1802 1802 Ross-Avenue-e St. Paul, MN 55119
Estimated Value: $214,000 - $247,403
2
Beds
2
Baths
924
Sq Ft
$256/Sq Ft
Est. Value
About This Home
This home is located at 1802 1802 Ross-Avenue-e, St. Paul, MN 55119 and is currently estimated at $236,601, approximately $256 per square foot. 1802 1802 Ross-Avenue-e is a home located in Ramsey County with nearby schools including Hazel Park Preparatory Academy, Txuj Ci HMong Language and Culture Upper Campus, and Johnson Senior High School.
Ownership History
Date
Name
Owned For
Owner Type
Purchase Details
Closed on
Aug 3, 2023
Sold by
3Packet Com Inc
Bought by
Doyal Jazmyn
Current Estimated Value
Home Financials for this Owner
Home Financials are based on the most recent Mortgage that was taken out on this home.
Original Mortgage
$236,634
Outstanding Balance
$42,344
Interest Rate
6.96%
Mortgage Type
FHA
Estimated Equity
$194,257
Purchase Details
Closed on
Sep 20, 2018
Sold by
Imperial Valley Properties Llc
Bought by
Jazz Up Indy Inc
Purchase Details
Closed on
Apr 6, 2018
Sold by
Jazz Up Indy Inc
Bought by
3Packet Com Inc
Purchase Details
Closed on
Oct 19, 2017
Sold by
Xc
Bought by
Cx
Purchase Details
Closed on
May 23, 2002
Sold by
Stahlman Luke and Stahlman Barbara
Bought by
Bleske William and Bleske Sheila
Create a Home Valuation Report for This Property
The Home Valuation Report is an in-depth analysis detailing your home's value as well as a comparison with similar homes in the area
Home Values in the Area
Average Home Value in this Area
Purchase History
| Date | Buyer | Sale Price | Title Company |
|---|---|---|---|
| Doyal Jazmyn | $241,000 | Trademark Title | |
| Jazz Up Indy Inc | -- | None Available | |
| 3Packet Com Inc | $56,500 | None Available | |
| Cx | -- | None Available | |
| Bleske William | $126,900 | -- |
Source: Public Records
Mortgage History
| Date | Status | Borrower | Loan Amount |
|---|---|---|---|
| Open | Doyal Jazmyn | $236,634 | |
| Closed | Doyal Jazmyn | $236,634 |
Source: Public Records
Tax History Compared to Growth
Tax History
| Year | Tax Paid | Tax Assessment Tax Assessment Total Assessment is a certain percentage of the fair market value that is determined by local assessors to be the total taxable value of land and additions on the property. | Land | Improvement |
|---|---|---|---|---|
| 2025 | $1,694 | $235,500 | $30,000 | $205,500 |
| 2023 | $1,694 | $124,600 | $25,000 | $99,600 |
| 2022 | $3,208 | $182,800 | $25,000 | $157,800 |
| 2021 | $5,028 | $135,000 | $25,000 | $110,000 |
| 2020 | $4,396 | $112,000 | $14,300 | $97,700 |
| 2019 | $4,076 | $87,500 | $14,300 | $73,200 |
| 2018 | $1,916 | $107,300 | $14,300 | $93,000 |
| 2017 | $6,478 | $93,300 | $14,300 | $79,000 |
| 2016 | $6,028 | $0 | $0 | $0 |
| 2015 | $5,442 | $89,700 | $14,300 | $75,400 |
| 2014 | $4,962 | $0 | $0 | $0 |
Source: Public Records
Map
Nearby Homes
- 1803 Bush Ave E
- 1766 Ross Ave
- 1764 Bush Ave
- 1736 Ross Ave
- 1752 Stillwater Ave
- 1769 York Ave
- 1824 Sims Ave
- 1784 Sims Ave
- 1685 Bush Ave
- 1747 York Ave
- 1751 Margaret St
- 1683 Minnehaha Ave E
- 1661 Bush Ave
- 1675 Minnehaha Ave E
- 834 Iroquois Ave
- 2002 Nortonia Ave
- 1631 Ross Ave
- 2015 Bush Ave E
- 1979 Stillwater Ave E
- 1950 Case Ave E
- 1802 Ross Ave E
- 1806 Ross Ave E
- 1796 Ross Ave E
- 1810 Ross Ave E
- 1810 1810 Ross Ave E
- 1812 Ross Ave E
- 1807 1807 Ross-Avenue-e
- 1807 1807 Ross Ave E
- 1816 Ross Ave E
- 1816 1816 Ross-Avenue-e
- 1816 1816 Ross Ave E
- 1799 Ross Ave E
- 1795 Ross Ave E
- 1795 1795 Ross-Avenue-e
- 1807 Ross Ave E
- 1795 Bush Ave E
- 1811 1811 Ross-Avenue-
- 1803 1803 Bush Ave E
- 1820 Ross Ave E
- 1811 Ross Ave E