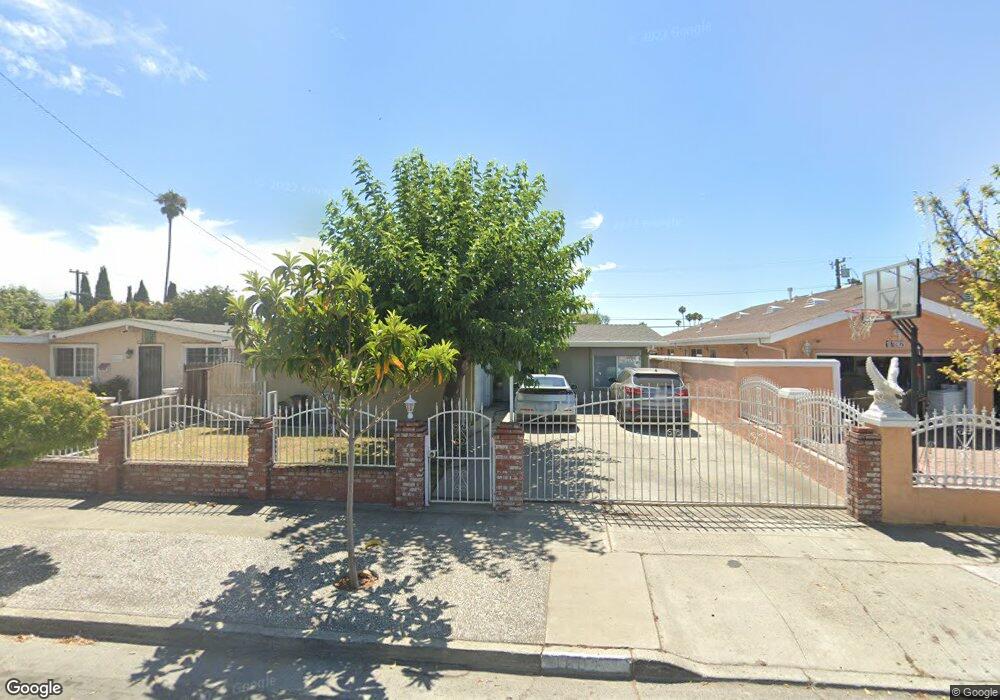
1802 Biscayne Way San Jose, CA 95122
Hillview North NeighborhoodEstimated Value: $836,505 - $1,013,000
3
Beds
2
Baths
1,040
Sq Ft
$877/Sq Ft
Est. Value
About This Home
This home is located at 1802 Biscayne Way, San Jose, CA 95122 and is currently estimated at $911,876, approximately $876 per square foot. 1802 Biscayne Way is a home located in Santa Clara County with nearby schools including A. J. Dorsa Elementary School, Clyde L. Fischer Middle School, and William C. Overfelt High School.
Ownership History
Date
Name
Owned For
Owner Type
Purchase Details
Closed on
Oct 24, 2016
Sold by
Mendez Luis A and Avila Irma C
Bought by
The Avila Mendez Family Trust and Mendez Luis A
Current Estimated Value
Purchase Details
Closed on
Aug 24, 1998
Sold by
Irma Avila
Bought by
Mendez Luis A and Avila Irma C
Home Financials for this Owner
Home Financials are based on the most recent Mortgage that was taken out on this home.
Original Mortgage
$34,500
Interest Rate
6.91%
Mortgage Type
Stand Alone Second
Purchase Details
Closed on
Oct 22, 1996
Sold by
Irma Avila and Irma Rafael C
Bought by
Avila Irma
Purchase Details
Closed on
Oct 22, 1993
Sold by
Jobalia Kirti and Jobalia Jyotsua
Bought by
Avila Irma and Avila Rafael C
Home Financials for this Owner
Home Financials are based on the most recent Mortgage that was taken out on this home.
Original Mortgage
$140,600
Interest Rate
6.95%
Create a Home Valuation Report for This Property
The Home Valuation Report is an in-depth analysis detailing your home's value as well as a comparison with similar homes in the area
Home Values in the Area
Average Home Value in this Area
Purchase History
| Date | Buyer | Sale Price | Title Company |
|---|---|---|---|
| The Avila Mendez Family Trust | -- | None Available | |
| Mendez Luis A | -- | Financial Title Company | |
| Avila Irma | -- | -- | |
| Avila Irma | $148,000 | First American Title Guarant |
Source: Public Records
Mortgage History
| Date | Status | Borrower | Loan Amount |
|---|---|---|---|
| Closed | Mendez Luis A | $34,500 | |
| Closed | Avila Irma | $140,600 |
Source: Public Records
Tax History Compared to Growth
Tax History
| Year | Tax Paid | Tax Assessment Tax Assessment Total Assessment is a certain percentage of the fair market value that is determined by local assessors to be the total taxable value of land and additions on the property. | Land | Improvement |
|---|---|---|---|---|
| 2025 | $5,560 | $252,106 | $132,209 | $119,897 |
| 2024 | $5,560 | $247,164 | $129,617 | $117,547 |
| 2023 | $5,405 | $242,319 | $127,076 | $115,243 |
| 2022 | $5,279 | $237,569 | $124,585 | $112,984 |
| 2021 | $5,048 | $232,912 | $122,143 | $110,769 |
| 2020 | $4,844 | $230,525 | $120,891 | $109,634 |
| 2019 | $4,670 | $226,006 | $118,521 | $107,485 |
| 2018 | $4,576 | $221,576 | $116,198 | $105,378 |
| 2017 | $4,554 | $217,232 | $113,920 | $103,312 |
| 2016 | $4,316 | $212,974 | $111,687 | $101,287 |
| 2015 | $4,296 | $209,776 | $110,010 | $99,766 |
| 2014 | $3,394 | $205,668 | $107,856 | $97,812 |
Source: Public Records
Map
Nearby Homes
- 1519 Orlando Dr
- 1653 S King Rd
- 1693 Christopher St
- 1483 Florida Ave
- 1899 Bermuda Way
- 1902 S King Rd
- 1660 Marsh St
- 1944 S King Rd
- 1912 Sumatra Ave
- 1549 Terilyn Ave
- 1667 Terilyn Ave
- 1476 Midfield Ave
- 2036 Cunningham Ave
- 2040 Lanai Ave
- 2404 Lucerne Way
- 1362 Mcquesten Dr Unit A
- 2091 Manassas Ct
- 2428 Barlow Ave
- 2493 Alfred Way
- 1386 Sunbeam Cir
- 1792 Biscayne Way
- 1812 Biscayne Way
- 1778 Biscayne Way
- 1820 Biscayne Way
- 1789 Loyola Dr
- 1797 Loyola Dr
- 1779 Loyola Dr
- 1771 Loyola Dr
- 1807 Loyola Dr
- 1764 Biscayne Way
- 1828 Biscayne Way
- 1546 Cliffwood Dr
- 1791 Biscayne Way
- 1815 Loyola Dr
- 1761 Loyola Dr
- 1777 Biscayne Way
- 1834 Biscayne Way
- 1754 Biscayne Way
- 1536 Cliffwood Dr
- 1821 Biscayne Way