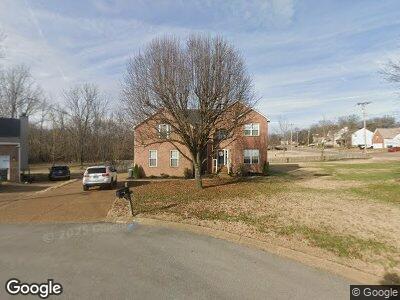
1802 Partridge Ct Mount Juliet, TN 37122
Estimated Value: $496,898 - $536,000
--
Bed
3
Baths
2,702
Sq Ft
$191/Sq Ft
Est. Value
About This Home
This home is located at 1802 Partridge Ct, Mount Juliet, TN 37122 and is currently estimated at $515,975, approximately $190 per square foot. 1802 Partridge Ct is a home located in Wilson County with nearby schools including Springdale Elementary School, West Wilson Middle School, and Mt. Juliet High School.
Ownership History
Date
Name
Owned For
Owner Type
Purchase Details
Closed on
Mar 2, 2015
Sold by
Duffy James Patrick
Bought by
Duffy Melissa
Current Estimated Value
Home Financials for this Owner
Home Financials are based on the most recent Mortgage that was taken out on this home.
Original Mortgage
$103,000
Outstanding Balance
$40,195
Interest Rate
3.69%
Mortgage Type
New Conventional
Estimated Equity
$469,332
Purchase Details
Closed on
Aug 25, 1997
Sold by
Westminster Homes Inc
Bought by
James Duffy and James Melissa
Home Financials for this Owner
Home Financials are based on the most recent Mortgage that was taken out on this home.
Original Mortgage
$168,350
Interest Rate
7.43%
Purchase Details
Closed on
Aug 21, 1997
Sold by
Westminster Homes Inc
Bought by
Patrick Duffy James
Home Financials for this Owner
Home Financials are based on the most recent Mortgage that was taken out on this home.
Original Mortgage
$168,350
Interest Rate
7.43%
Purchase Details
Closed on
Mar 19, 1997
Bought by
Westminster Homes Inc
Create a Home Valuation Report for This Property
The Home Valuation Report is an in-depth analysis detailing your home's value as well as a comparison with similar homes in the area
Home Values in the Area
Average Home Value in this Area
Purchase History
| Date | Buyer | Sale Price | Title Company |
|---|---|---|---|
| Duffy Melissa | -- | -- | |
| James Duffy | $177,235 | -- | |
| Patrick Duffy James | $177,235 | -- | |
| Westminster Homes Inc | $74,300 | -- |
Source: Public Records
Mortgage History
| Date | Status | Borrower | Loan Amount |
|---|---|---|---|
| Open | Duffy Melissa | $103,000 | |
| Previous Owner | Duffy James P | $152,000 | |
| Previous Owner | Westminster Homes Inc | $168,350 |
Source: Public Records
Tax History Compared to Growth
Tax History
| Year | Tax Paid | Tax Assessment Tax Assessment Total Assessment is a certain percentage of the fair market value that is determined by local assessors to be the total taxable value of land and additions on the property. | Land | Improvement |
|---|---|---|---|---|
| 2024 | $1,825 | $95,600 | $18,750 | $76,850 |
| 2022 | $1,825 | $95,600 | $18,750 | $76,850 |
| 2021 | $1,930 | $95,600 | $18,750 | $76,850 |
| 2020 | $1,861 | $95,600 | $18,750 | $76,850 |
| 2019 | $230 | $69,325 | $15,625 | $53,700 |
| 2018 | $1,858 | $69,200 | $15,625 | $53,575 |
| 2017 | $1,858 | $69,200 | $15,625 | $53,575 |
| 2016 | $1,858 | $69,200 | $15,625 | $53,575 |
| 2015 | $1,917 | $69,200 | $15,625 | $53,575 |
| 2014 | $1,505 | $54,336 | $0 | $0 |
Source: Public Records
Map
Nearby Homes
- 214 Cobblestone Landing
- 1401 Thrush Ct
- 134 Normandy Dr
- 4108 New Hope Meadow Rd
- 13 Settlers Ct
- 125 Normandy Dr
- 6307 N New Hope Rd
- 300 Cobblestone Landing
- 2260 Monthemer Cove
- 301 Jasmine Park
- 413 Gingerwood Ct
- 1040 Lionheart Dr
- 409 Gingerwood Ct
- 401 Gingerwood Ct
- 1242 Wallace Way
- 2205 Monthemer Cove
- 1033 Lionheart Dr
- 509 Crescent Moon Ln
- 505 Crescent Moon Ln
- 1028 Lionheart Dr
- 1802 Partridge Ct
- 1800 Partridge Ct
- 1804 Partridge Ct
- 1805 Partridge Ct
- 1803 Partridge Ct
- 1801 Partridge Ct
- 1635 Eagle Trace Dr
- 1633 Eagle Trace Dr
- 1631 Eagle Trace Dr
- 1629 Eagle Trace Dr
- 1637 Eagle Trace Dr
- 221 Cobblestone Landing
- 223 Cobblestone Landing
- 1627 Eagle Trace Dr
- 225 Cobblestone Landing
- 1903 Partridge Dr
- 227 Cobblestone Landing
- 219 Cobblestone Landing
- 229 Cobblestone Landing